Undergraduate CS Degree Production Rises; Doctoral Production Steady
2009-2010 Taulbee Survey
The CRA Taulbee Survey1 is conducted annually by the Computing Research Association to document trends in student enrollment, degree production, employment of graduates, and faculty salaries in Ph.D.-granting departments of computer science (CS),computer engineering (CE) and information (I)2 in the United States and Canada. This article and the accompanying figures and tables present the results of the 40th annual CRA Taulbee Survey.
Information is gathered during the fall. Responses received by January 5, 2011 are included in the analysis. The period covered by the data varies from table to table. Degree production and enrollment (Ph.D., Master’s, and Bachelor’s) refer to the previous academic year (2009-10). Data for new students in all categories refer to the current academic year (2010-11). Projected student production and information on faculty salaries and demographics also refer to the current academic year. Faculty salaries are those effective January 1, 2011.
For this report, we surveyed a total of 265 Ph.D.-granting departments. Of the departments surveyed, 195 returned their survey forms, for a response rate of 74 percent. This is higher than last year’s 71 percent. There is a lower response rate from the I departments (68 percent—but their participation in the survey continues to increase since they were first included two years ago) and Canadian departments (62 percent), and a typical low response rate (40 percent) from CE programs. We had a good response rate from U.S. CS departments (150 of 184, or 82 percent).3
Departments that responded to the survey were sent preliminary results about faculty salaries in December 2010; these results included additional distributional information not contained in this report. The CRA Board views this as a benefit of participating in the survey.
While we continue to report U.S. CS departments with the (now very dated) 1995 NRC rankings, we are reviewing alternative stratification of these departments based on other factors. We are hopeful that an update to this report can be issued later in the year reflecting a new stratification methodology, and that future reports will reflect the new methodology.
We thank all respondents who completed this year’s questionnaire. Departments that participated are listed at the end of this article.
Ph.D. Degree Production, Enrollments and Employment (Tables 1-8)
Total Ph.D. production in computing programs (Table 1) held steady in 2009-10, with 1,772 degrees granted compared with 1,747 last year with fewer departments reporting. Computer science degree production also was flat (1,481 vs. 1,473 last year). This follows a drop in production last year. As was pointed out last year, the economic conditions that resulted in some students delaying graduation two years ago and instead graduating last year may have halted what might otherwise have been another year of declining production last year.
The 2009-10 production of 1,772 is well below the 2,009 predicted in last year’s survey. The “optimism ratio,” defined as the actual number divided by the predicted number, was 0.88, better than last year’s 0.83. Departments notoriously over-predict the number of Ph.D. graduates. The prediction for 2010-11 graduates is 2,055, similar to what they predicted last year.
The number of new students passing thesis candidacy exams in U.S. CS departments (most, but not all, departments have such exams) was flat after accounting for the additional departments reporting. The overall number of students passing the qualifier also was flat in these departments.
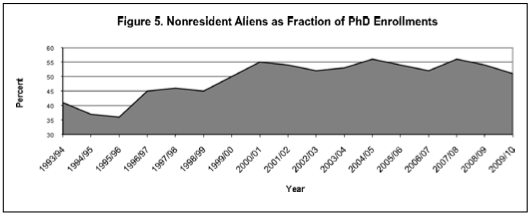
For the second year in a row, the number of new Ph.D. students overall (Table 5) is about the same as last year (2,962 this year vs 2,995 last year). However, with the increased number of departments reporting this year, this total actually represents a slight decline. The number of new students in computer engineering programs also declined. This year, there was a decline in the proportion of new doctoral students from outside North America (Table 5a), from 59.1% last year to 56.8% this year. However, this still is greater than the 54% from outside North America two years ago. Total enrollment in computer science doctoral programs (Table 6) is comparable to that of last year, after accounting for the increased number of departments reporting this year.
Figure 3 shows a graphical view of the pipeline for computer science programs. The data in this graph are normalized by the number of departments reporting. The graph offsets the qualifier data by one year from the data for new students, and offsets the graduation data by five years from the data for new students. These data have been useful in estimating the timing of changes in production rates.
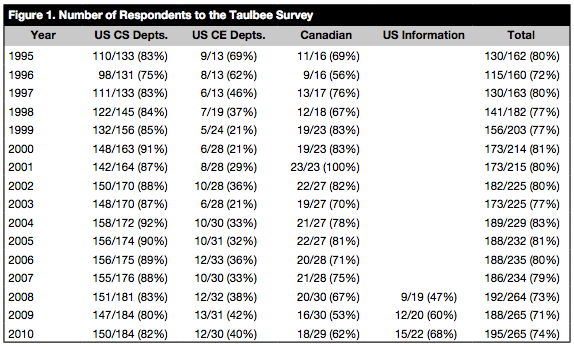
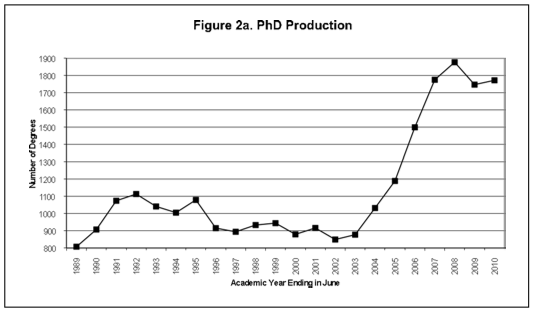
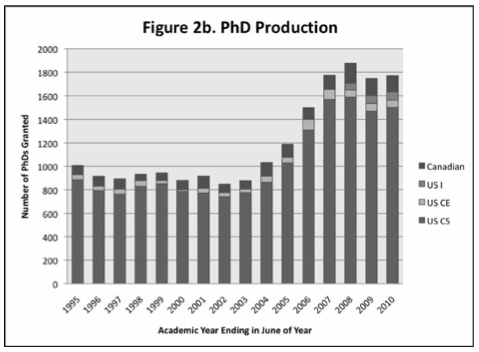
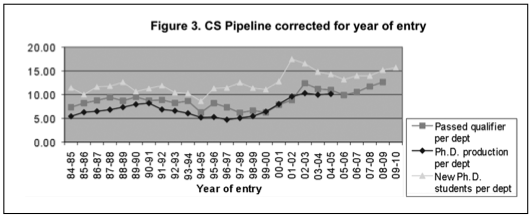
Figure 4 shows the employment trend of new Ph.D.s in academia and industry, those taking employment outside of North America, and those going to academia who took positions in departments other than Ph.D.-granting CS/CE departments. Table 4shows a more detailed breakdown of the employment data for new Ph.D.s. There continues to be a decline in the fraction of new Ph.D.s who take positions in industry (44.7% in 2009-10 vs. 47.1% in 2008-09 and 56.6% in 2007-08). A similar fraction of graduates took academic jobs in 2009-10 as did so in 2008-09. However, once again many more graduates went into academic positions as post-doctoral employees in 2009-10, while the fraction taking tenure-track positions dropped from 10.4% in 2008-09 to 8.2% in 2009-10.
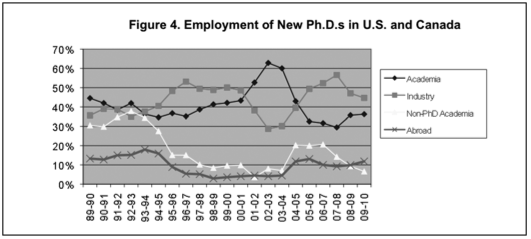
The unemployment rate for new Ph.D.s remains approximately 1%. The proportion of Ph.D. graduates who were reported taking positions outside of North America, among those whose employment is known, jumped to 11.8% in 2009-10 from 9.9% in 2008-09 and 9.2% in 2007-08. This is a trend that bears watching.
Table 4 also indicates the areas of specialty of new CS/CE Ph.D.s. More doctoral graduates specialized in artificial intelligence, informatics: biomedical/other science, operating systems, scientific computing and social computing in 2009-10 than did so in 2008-09, while a smaller proportion specialized in databases/information retrieval (second year in a row), human-computer interaction, and high-performance computing. There have been few long-term trends in these specialization data over the years, so these year-to-year differences should not be construed as necessarily indicative of any shift in emphasis.
A smaller fraction of this year’s computer science graduates were women (18.8% vs. 20.8% last year) while a larger fraction of this year’s I school graduates were women (40.2% vs. 36.1% last year). A larger fraction of this year’s graduates were White (36.7% vs. 33.3% last year). This change was largest at I schools, where there was a 15% larger fraction of Whites and a 10% smaller fraction of Non-resident Aliens, but this may reflect differences in the specific departments reporting this year.
Master’s and Bachelor’s Degree Production and Enrollments (Tables 9-16)
This section reports data about enrollment and degree production for Master’s and Bachelor’s programs in the doctoral-granting departments. Although the absolute number of degrees and students enrolled reported herein only reflect departments that offer the doctoral degree, the trends observed in the master’s and bachelor’s data from these departments tend to strongly reflect trends in the larger population of programs that offer such degrees.
Master’s degree production in CS was flat in 2009-10 with 6,851 graduates (Tables 9b-11b). Production declined in CE departments and increased in I departments, the reverse of what was experienced last year. However, these changes may reflect nothing more than changes in the programs reporting.
There were very small changes in 2009-10 in the proportion of female graduates among master’s recipients. There has been little change in the gender balance among CS master’s recipients for many years. A higher fraction of the I department master’s recipients were Non-resident Aliens in 2009-10. In CE departments, the reverse held, with a corresponding increase in the fraction of master’s graduates who were White. CS programs showed little change in ethnicity characteristics, if Non-resident Aliens and (resident) Asians are combined. We suspect that some departments incorrectly classify some Non-resident Aliens as resident Asians.
There is an increase in the number of new master’s students in CS programs this year, to 5,881 from 5,440 last year (Table 13). Changes in new enrollment among CE and I programs appear consistent with changes in the number of departments in these categories that reported.
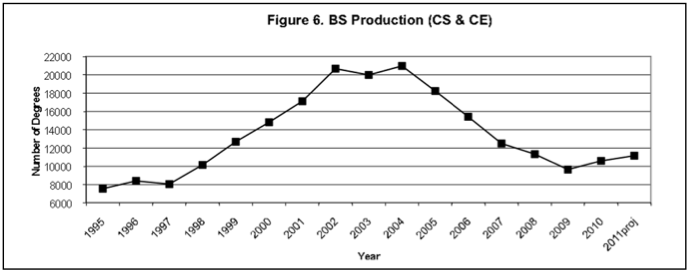
Overall bachelor’s degree production in 2010 rose nearly 11 percent from that in 2009 (Tables 9a-11a). Bachelor’s degree production in U.S. CS departments was up more than 9 percent. The increases in new students observed during each of the previous two years have resulted in increased degree production, a welcome turnaround from the past several years of declining bachelor’s degree production.
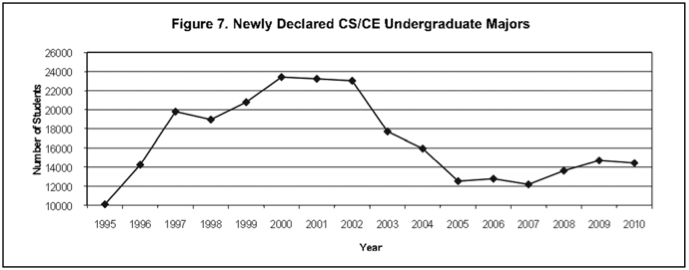
The number of new students in U.S. CS programs continues to increase (Table 14). The number of new CS majors among U.S. computer science departments is about the same as last year, but there was a huge (50 percent) increase in the number of new pre-majors (students who are pursuing a curriculum for the major in computer science but as yet have not declared their official major). It should be noted that a relatively small number of programs have the pre-major status, and not all of them report data every year. For programs who reported non-zero numbers of pre-majors last year and this year, the increase was 22 percent. Total enrollment among majors and pre-majors in U.S. CS departments increased 10 percent (Table 16), although about one-third of these departments still report decreases in total enrollment. This is the third straight year of increases in total enrollment, and indicates that the post dot-com decline in undergraduate computing program enrollments is over.
In Canada, the number of new CS majors increased for the third straight year, by nearly 4 percent, but the total number of CS majors declined by nearly 8 percent. Bachelor’s degree production in Canada increased by more than 15 percent. These trends are significantly influenced by the specific departments reporting.
Because of the newness of the I-school data and the increasing number of I-schools reporting, it is not appropriate to try to discern any enrollment patterns at this time. Computer engineering enrollment data appear comparable to those from last year in aggregate, for the second year in a row, although there are more pre-majors this year.
The fraction of women among bachelor’s graduates increased this year in all three areas (CS, CE and I), though only 13.8 percent of bachelor’s graduates in CS, 10.4 percent in CE, and 14.5 percent in I, were women. Ethnicity patterns were similar to last year, though this year there are somewhat fewer Whites and more Non-resident Alien graduates in both CS and I programs.
Faculty Demographics (Tables 17-23)
Table 17 shows the current and anticipated sizes for tenure-track, teaching and research faculty, and postdocs. While analyzing this year’s faculty demographic data, we discovered that previous years’ counts were reported incorrectly for certain of these classes. While tenure-track and total counts were accurate, the teaching, research, and postdoc numbers typically were transposed. This problem appears to have begun with the 2006-07 report, which provided actual counts for the 2007-08 academic year. So that our readers may have the correct trend data for their own information and use, we are including this year a special table, Table 17a, that shows the corrected actual figures for each academic year, beginning 2005-06.
Tenure-track faculty size rebounded this year from last year’s losses. The 6.7% increase this year returns the tenure-track level to that of two years ago. However, at U.S. CS departments the increase was only 3.3%, and some of this is due to an increased number of departments reporting this year. The use of postdocs continued to grow at an astonishing rate of 31.8% this year. The postdoc numbers have more than doubled in a four-year period. Teaching faculty numbers rose 6.4% while research faculty numbers dropped 7.3%.
The overall totals reflect a 5.6% increase. However, among U.S. CS departments the overall increase was a modest 1.3%. Large increases in CE, I, and Canadian totals were present this year (20.7%, 33.1% and 20.9%, respectively), but the specific departments reporting in those sectors makes these data subject to larger swings from year to year.
Table 18b shows the continued effects of the economy on faculty hiring this past year. There were only 211 tenure-track vacancies reported in 2009-10, a 17% decrease from 2008-09 and nearly a 60% decrease from 2007-08. Of these, 29.9% were reported unfilled, better than the 35.4% in 2008-09. The fraction of women hired into tenure-track positions (Table 19) rose again in 2009-10, to 26.5% from 23.1% in 2008-09 and 21.9% in 2007-08. With only 19.9% of new Ph.D.s being women, this year’s tenure-track faculty hiring would appear to continue the trend toward increased gender diversity. The fraction of women among new postdocs also rose, from 15.3% to 19.5%. This year there was an increased percentage of new faculty members who are White and those who are Resident Hispanic, while there was a decrease in the percentage who are Non-resident Aliens (Table 20).
There was a slight increase in the overall fraction of women at the assistant and full professor ranks (Table 21). The largest increase again was at the assistant professor level, where the fraction of women rose to 25.8% from 24.3% last year and 21.7% two years ago. There also are more Whites and fewer Asians and Non-resident Aliens among current assistant professors this year compared with last year (Table 22).
For next year, reporting departments forecast a 3% growth in tenure-track faculty. Last year’s forecast was for a 2% growth. U.S. CS departments also forecast a 3% growth for next year, and their actual growth this year was very close to the estimates they made last year.
There was a 9% increase in the overall number of faculty losses this year, due to an increased number of retirements (73 vs 53 last year). As the baby-boomer retirement years commence, it will be interesting to see if this is the beginning of a trend toward higher retirement rates or simply a one-time spike (Table 23).
Research Expenditures and Graduate Student Support (Tables 24-26)
Table 24-1 shows the department’s total expenditure (including indirect costs or “overhead” as stated on project budgets) from external sources of support. Table 24-2shows the per capita expenditure, where capitation is computed two ways. The first is relative to the number of tenured and tenure-track faculty members. The second is relative to researchers and postdocs as well as tenured and tenure-track faculty. Canadian levels are shown in Canadian dollars. The U.S. CS data indicate that the higher the ranking, the more external funding is received by the department (both in total and per capita).
This year mean total expenditures rose among U.S. CS departments by over 8%, with increases in all strata except those departments ranked 25-36. Median total expenditures also rose in each U.S. CS stratum except for departments ranked 25-36. Significant increases in both mean and median expenditures were observed for CE and I departments. For Canadian departments, there was a significantly increased mean but a decreased median, clearly reflecting the particular departments that reported this year versus last year.
Per-capita expenditure results based on the first capitation method generally reflect the total expenditure results, although an anomalous value in I departments last year caused the mean per faculty member to drop this year while the mean total expenditures increased. Results using the second capitation method mirror those using the first method, except that median expenditures dropped for U.S. CS departments ranked 1-12 and mean expenditures were flat for this stratum, and mean expenditures dropped for departments ranked 13-24.
Table 25 shows the number of graduate students supported as full-time students as of fall 2010, further categorized as teaching assistants (TAs), research assistants (RAs), fellows, or computer systems supporters, and also shows the split between those on institutional vs. external funds. The number of TAs in CS departments increased more than 12% this year. Support for RAs and fellows shifted considerably this year in some strata. In departments ranked 1-12, there were many fewer reported RAs in total this year compared with last year, and more of the RAs were on institutional funds. While there were more externally supported fellows this year in departments ranked 1-12, there were fewer total fellows. In departments ranked 13-24, there were many more RAs this year in both externally supported and institutionally supported categories, but fewer fellows in each of these two categories. Departments ranked 25-36 also had more RAs and fewer fellows in both categories, while departments ranked greater than 36 had more externally supported and fewer institutionally supported RAs and fellows this year.
Median stipends for TAs and RAs rose this year, except in U.S. CS departments ranked greater than 36, where they were flat (Table 26). U.S. Information departments also showed very small changes, though there are many fewer departments reporting in this category. Entries in this table show the net amount (as of fall 2010) of an academic-year stipend for a first-year doctoral student (not including tuition or fees). Canadian stipends are shown in Canadian dollars.
Faculty Salaries (Tables 27-35)
Each department was asked to report individual (but anonymous) faculty salaries if possible; otherwise, the department was requested to provide the minimum, median, mean, and maximum salaries for each rank (full, associate, and assistant professors and non-tenure-track teaching faculty) and the number of persons at each rank. The salaries are those in effect on January 1, 2011. For U.S. departments, nine-month salaries are reported in U.S. dollars. For Canadian departments, twelve-month salaries are reported in Canadian dollars. Respondents were asked to include salary supplements such as salary monies from endowed positions.
The tables contain data about ranges and measures of central tendency only. Those departments reporting individual salaries were provided more comprehensive distributional information in December 2010. This year, 85% of those reporting salary data provided salaries at the individual level.
We also report salary data based on time in rank, for meaningful comparison of individual or departmental faculty salaries with national averages. We report associate professor salaries for time in rank of 7 years or less, and of more than 7 years. For full professors, we report time in rank of 7 years or less, 8 to 15 years, and more than 15 years.
The minimum and maximum of the reported salary minima (and maxima) are self-explanatory. The range of salaries in a given rank among departments that reported data for that rank is the interval [“minimum of the minima,” “maximum of the maxima”].
The mean of the reported salary minima (maxima) in a given rank is computed by summing the departmental reported minimum (maximum) and dividing by the number of departments reporting data at that rank. The “average of dept median salaries” at each rank is computed by summing the individual medians reported at each rank and dividing by the number of departments reporting at that rank. Thus, it is not a true median of all the salaries. Similarly, “average of dept mean salaries” at each rank is computed by summing the individual means reported at each rank and dividing by the number of departments reporting at that rank. Thus, it is not a true average of all the salaries.
Overall, U.S. CS average salaries (Table 27) increased between 0.3% and 0.7%, depending on tenure-track rank, and 0.2% for non-tenure-track teaching faculty. Even more strikingly than last year, the U.S. CS data reflect the low or nonexistent salary increases offered at many institutions due to economic realities, coupled with the effects of retirements and resignations of persons with relatively high salaries in their rank and the hirings and promotions of persons new to their rank.
Canadian salaries (Table 33) rose 1.9% to 3.1% among tenure-track ranks, with the largest increase at the associate professor rank and the smallest at the assistant professor rank. Non-tenure-track teaching faculty salaries for Canadian departments rose 10.6%. While these increases are much better than the U.S. CS increases, they are lower than the corresponding Canadian increases last year. Because of the sample sizes, Canadian values are affected more strongly than are U.S. values by the particular set of schools that responded to this year’s survey compared to those who responded last year.
Average salaries for new Ph.D.s (those who received their Ph.D. last year and then joined departments as tenure-track faculty) in U.S. departments decreased 1.7% from those reported in last year’s survey (Table 35). In each of the previous two years, salaries for new Ph.D.s. increased between 1.0% and 1.5%. There are about 70% as many new Ph.D. salaries reported this year compared with last year. Again this year, there were too few new Ph.D. salaries in Canadian departments to make meaningful comparisons.
Concluding Observations
Despite difficult economic times, academic computing programs seem to have held their own in 2009-10. Undergraduate enrollments increased, and graduate enrollments held steady. Though a smaller fraction of doctoral graduates took tenure-track positions available at North American Ph.D.-granting departments and positions in industry, post-doctoral positions utilizing the graduates’ doctoral computing expertise were available to them. It will be interesting to see the impact on the future faculty job market of this increased number of persons with post-doctoral research experience. It also will be interesting to see if the use of post-doctoral research positions continues near its present level once economic conditions improve.
Rankings
For tables that group computer science departments by rank, the rankings are based on information collected in the 1995 assessment of research and doctorate programs in the United States conducted by the National Research Council (NRC) [see http://archive.cra.org/statistics/nrcstudy2/home.html].
The top twelve schools in this ranking are: Stanford, Massachusetts Institute of Technology, University of California (Berkeley), Carnegie Mellon, Cornell, Princeton, University of Texas (Austin), University of Illinois (Urbana-Champaign), University of Washington, University of Wisconsin (Madison), Harvard, and California Institute of Technology. All schools in this ranking participated in the survey this year with the exception of the California Institute of Technology.
CS departments ranked 13-24 are: Brown, Yale, University of California (Los Angeles), University of Maryland (College Park), New York University, University of Massachusetts (Amherst), Rice, University of Southern California, University of Michigan, University of California (San Diego), Columbia, and University of Pennsylvania.4 All schools in this ranking participated in the survey this year.
CS departments ranked 25-36 are: University of Chicago, Purdue, Rutgers, Duke, University of North Carolina (Chapel Hill), University of Rochester, State University of New York (Stony Brook), Georgia Institute of Technology, University of Arizona, University of California (Irvine), University of Virginia, and Indiana. All schools in this ranking participated in the survey this year.
CS departments that are ranked above 36 or that are unranked that responded to the survey include: Arizona State University, Auburn, Boston University, Brandeis, Case Western Reserve, City University of New York Graduate Center, College of William and Mary, Colorado School of Mines, Colorado State, Dartmouth, DePaul, Drexel, Florida Institute of Technology, Florida International, Florida State, George Mason, George Washington, Georgia State, Illinois Institute of Technology, Iowa State, Johns Hopkins, Kansas State, Kent State, Lehigh, Louisiana State, Michigan State, Michigan Technological, Mississippi State, Montana State, Naval Postgraduate School, New Mexico Institute of Mining and Technology, New Mexico State, North Carolina State, North Dakota State, Northeastern, Northwestern, Oakland, Ohio, Ohio State, Old Dominion, Oregon State, Pace, Pennsylvania State, Polytechnic, Portland State, Rensselaer Polytechnic, Rochester Institute of Technology, Southern Illinois University (Carbondale), Stevens Institute of Technology, Syracuse, Texas A&M, Texas Tech, Toyota Technological Institute (Chicago), Tufts, Vanderbilt, Virginia Tech, Washington State, Washington (St. Louis), Wayne State, Western Michigan, Worcester Polytechnic, and Wright State.
University of: Alabama (Birmingham, Huntsville, and Tuscaloosa), Albany, Arkansas (Fayetteville), Buffalo, California (at Davis, Riverside, Santa Barbara, and Santa Cruz), Central Florida, Cincinnati, Colorado (Boulder and Colorado Springs), Connecticut, Delaware, Florida, Georgia, Idaho, Illinois (Chicago), Iowa, Kansas, Kentucky, Louisiana (Lafayette), Maine, Maryland (Baltimore Co.), Massachusetts (at Boston and Lowell), Minnesota, Mississippi, Missouri (at Columbia), Nebraska (Lincoln), Nevada (Las Vegas and Reno), New Hampshire, New Mexico, North Carolina (Charlotte), North Texas, Notre Dame, Oklahoma, Oregon, Pittsburgh, South Carolina, South Florida, Southern Mississippi, Tennessee (Knoxville), Texas (at Arlington, Dallas, El Paso, and San Antonio), Tulsa, Utah, and Wyoming.
Computer Engineering departments participating in the survey this year include: Boston University, Brigham Young, Clemson, Florida Institute of Technology, Iowa State, Northeastern, Old Dominion, Princeton, Santa Clara University, Virginia Tech, and the Universities of California (Santa Cruz), Iowa, New Mexico, and Southern California.
Canadian departments participating in the survey include:Concordia, Dalhousie, McGill, Memorial, Queen’s, Simon Fraser, and York Universities, and the Universities of: Alberta, British Columbia, Calgary, Manitoba, Montreal, Ottawa, Saskatchewan, Toronto, Victoria, Waterloo, and Western Ontario.
Information departments participating in the survey include:Cornell, Drexel, Indiana, Penn State, and Syracuse Universities, and the Universities of: California (Berkeley, Irvine, Los Angeles, and Santa Cruz), Illinois (Urbana-Champaign), Maryland (College Park and Baltimore County), Michigan, Pittsburgh, Texas (Austin), and Washington.
Acknowledgments
Betsy Bizot once again provided valuable assistance with the data collection, tabulation, and analysis for this survey. Thanks also are due to Betsy and to Jean Smith for their careful reading of the report and for their helpful suggestions to improve it.
Endnotes
- The title of the survey honors the late Orrin E. Taulbee of the University of Pittsburgh, who conducted these surveys for the Computer Science Board until 1984, with retrospective annual data going back to 1970.
- Information (I) programs included here are Information Science, Information Systems, Information Technology, Informatics, and related disciplines with a strong computing component. In fall 2008, the first year these programs were surveyed as part of Taulbee, surveys were sent to CRA members, the CRA Deans group members, and participants in the iSchools Caucus (www.ischools.org) that met the criteria of granting Ph.D.s and being located in North America. Other I-programs that meet these criteria and would like to participate in the survey in future years are invited to contact survey@cra.org for inclusion.
- The set of departments responding varies slightly from year to year, even when the total numbers are about the same; thus, we must approach any trend analysis with caution. We must be especially cautious in using the data about CE and I departments because of the low response rate.
- Although the University of Pennsylvania and the University of Chicago were tied in the National Research Council rankings, CRA made the arbitrary decision to place Pennsylvania in the second tier of schools.
- All tables with rankings: Statistics sometimes are given according to departmental rank. Schools are ranked only if they offer a CS degree and according to the quality of their CS program as determined by reputation. Those that only offer CE or I degrees are not ranked, and statistics are given on a separate line, apart from the rankings.
- All ethnicity tables: Ethnic breakdowns are drawn from guidelines set forth by the U.S. Department of Education.
- All faculty tables: The survey makes no distinction between faculty specializing in CS vs. CE programs. Every effort is made to minimize the inclusion of faculty in electrical engineering who are not computer engineers.