I. Appendix: List of Figures
A. CRA Enrollment Committee
No Figures
B. The Phenomenal Growth of CS Majors Since 2006
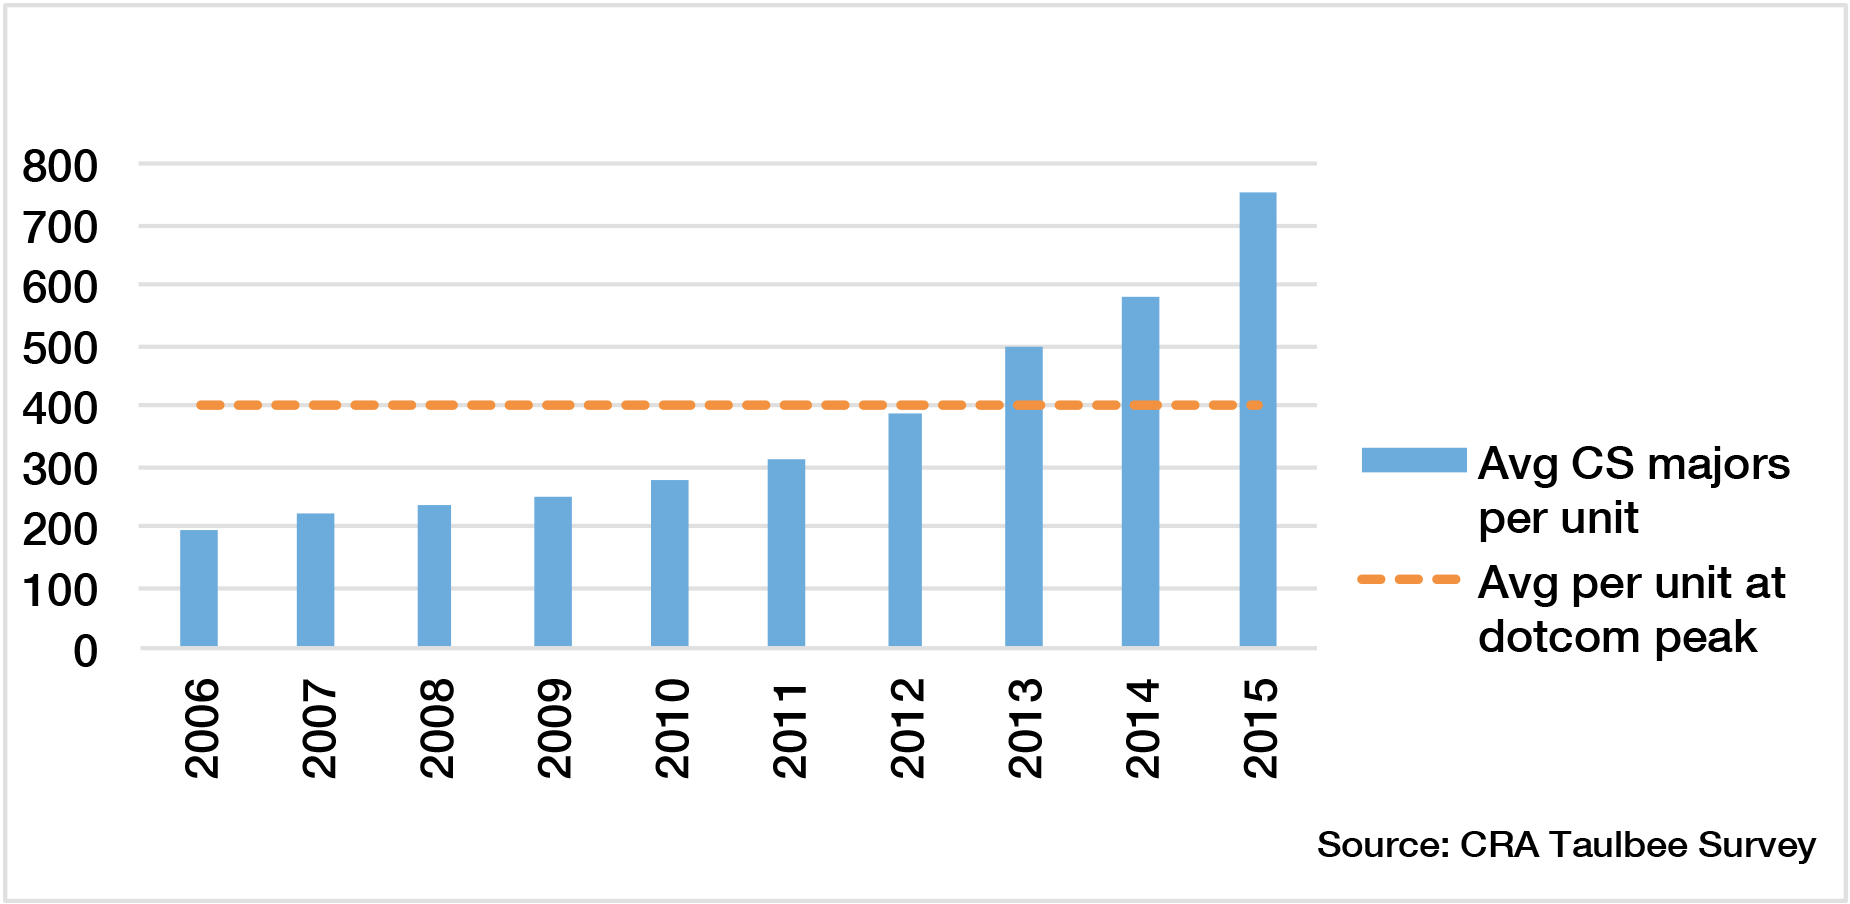
Figure B.1. Average number of CS majors per unit since 2006.
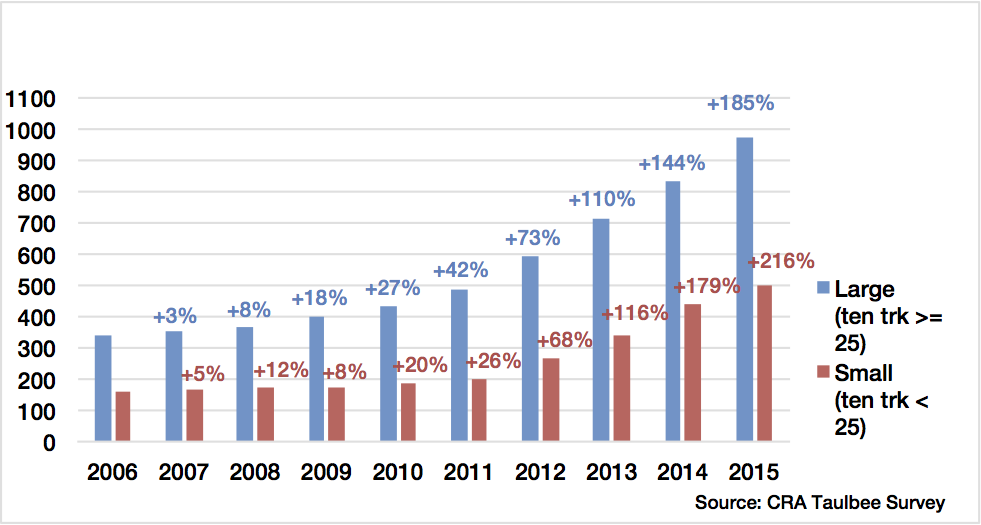
Figure B.2: Average enrollment by CS majors at large and small academic units (based on number of tenure track faculty). The percentages denote cumulative changes since 2006.
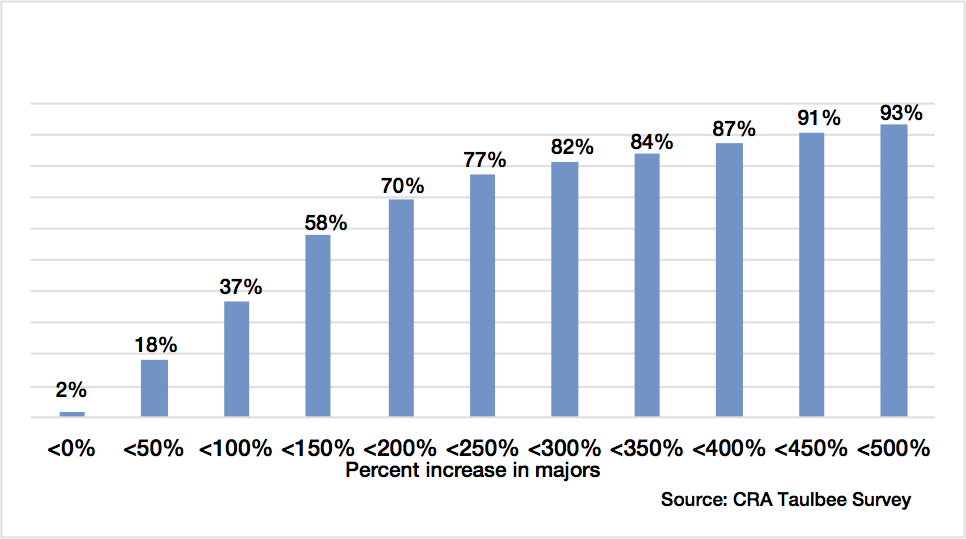
Figure B.3: Cumulative percent of units with the indicated level of growth in CS majors from 2009 to 2014.
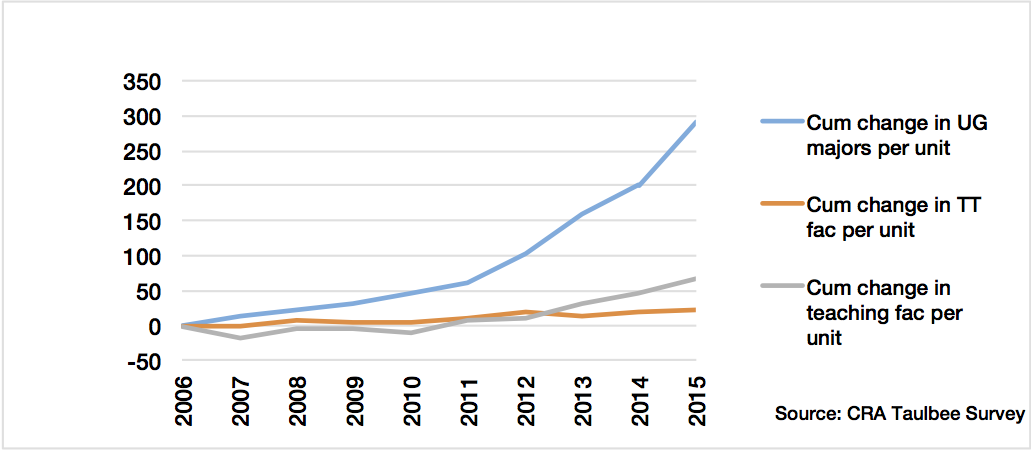
Figure B.4: Cumulative percent growth of CS majors and instructional faculty since 2006.
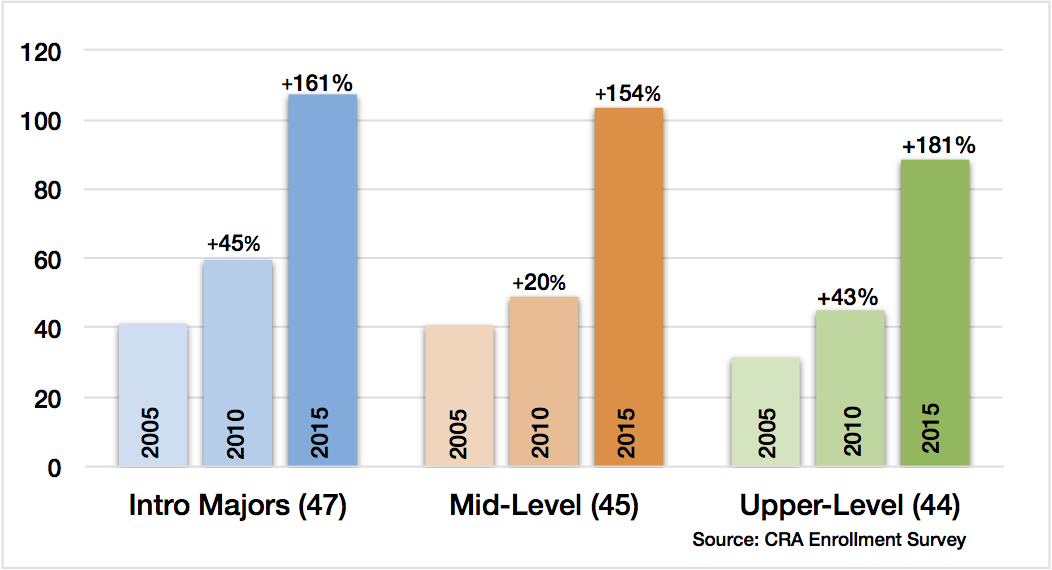
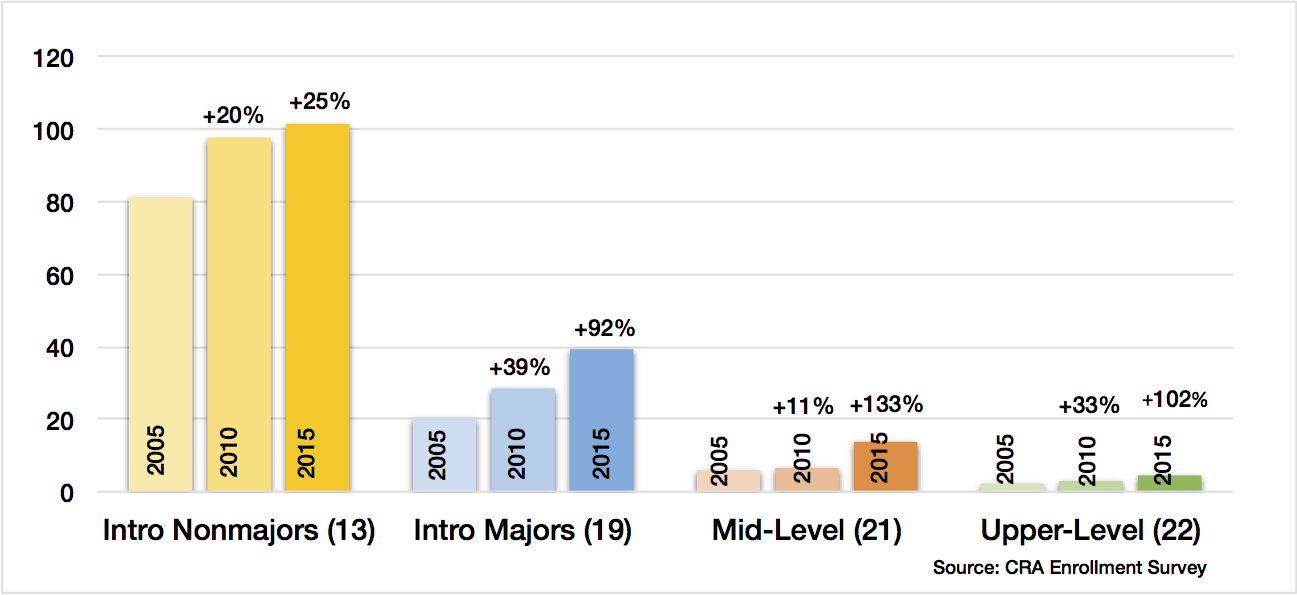
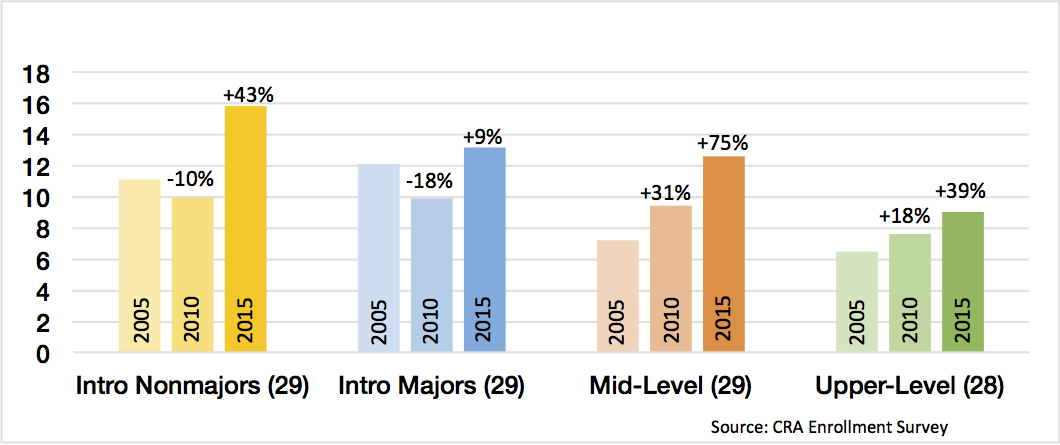
Figure B.5: Average enrollment by CS majors in computing courses at doctoral-granting units from 2005 to 2015. The number in parentheses in each category indicates sample size.
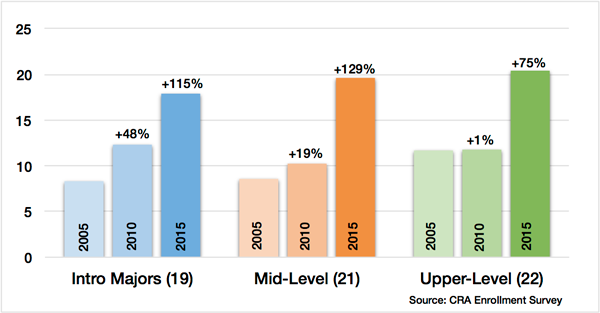
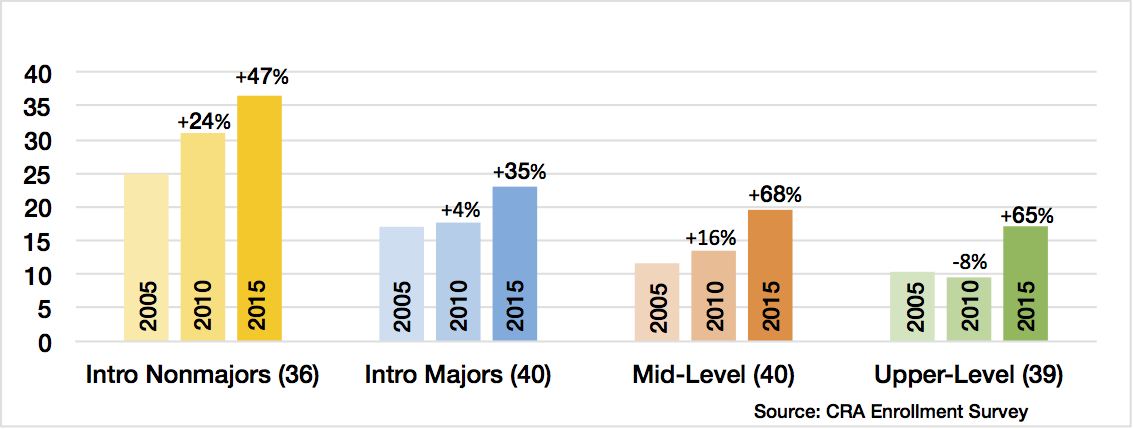
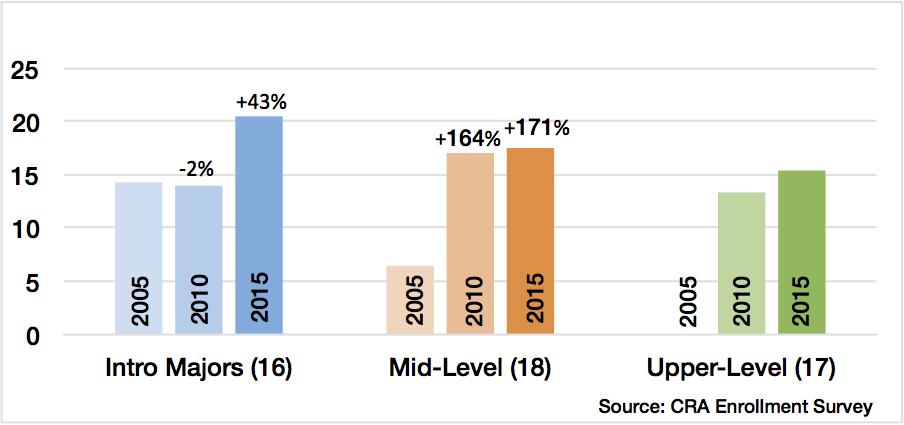
Figure B.6: Average enrollment by CS majors in computing courses at non-doctoral granting units from 2005 to 2015. The number in parentheses in each category indicates sample size.
C. The Widespread Increase in Nonmajor Enrollment
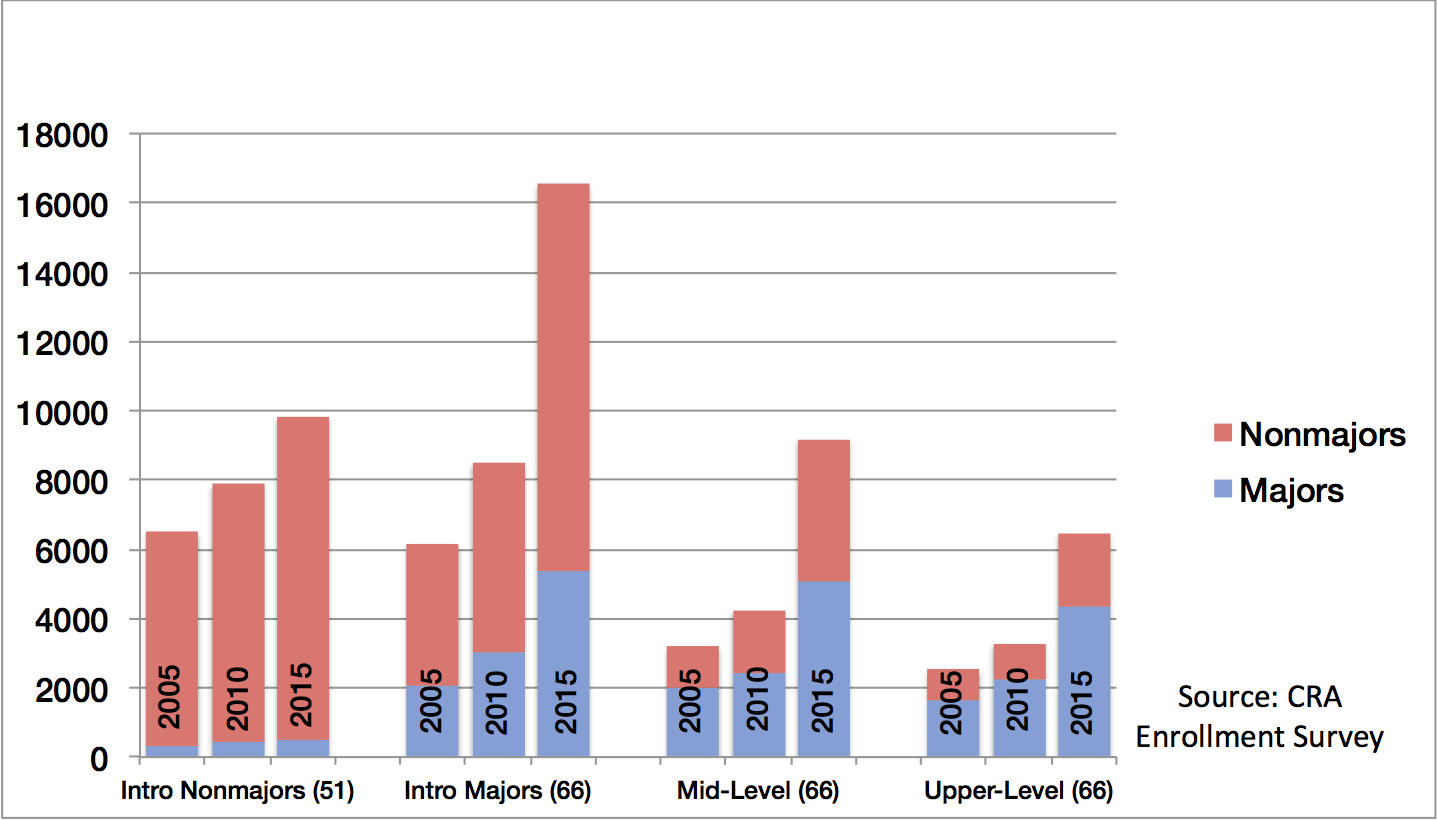
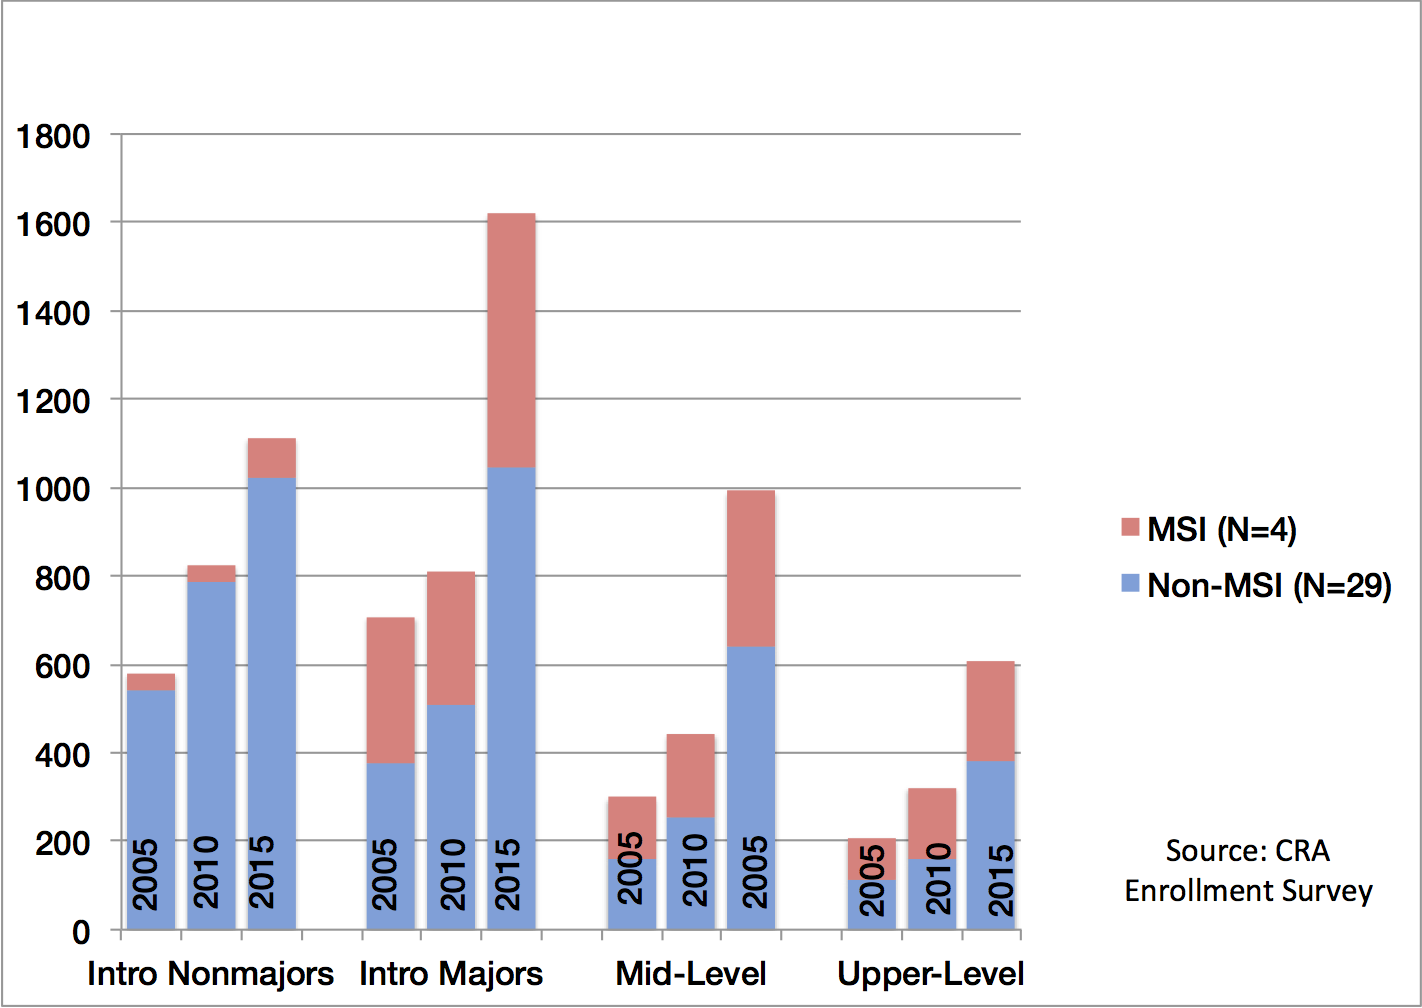
Figure C.1: Cumulative nonmajor enrollment (red) and major enrollment (blue) in computing courses at doctoral- and non-doctoral granting units from 2005 to 2015. The number in parentheses in each category indicates sample size.
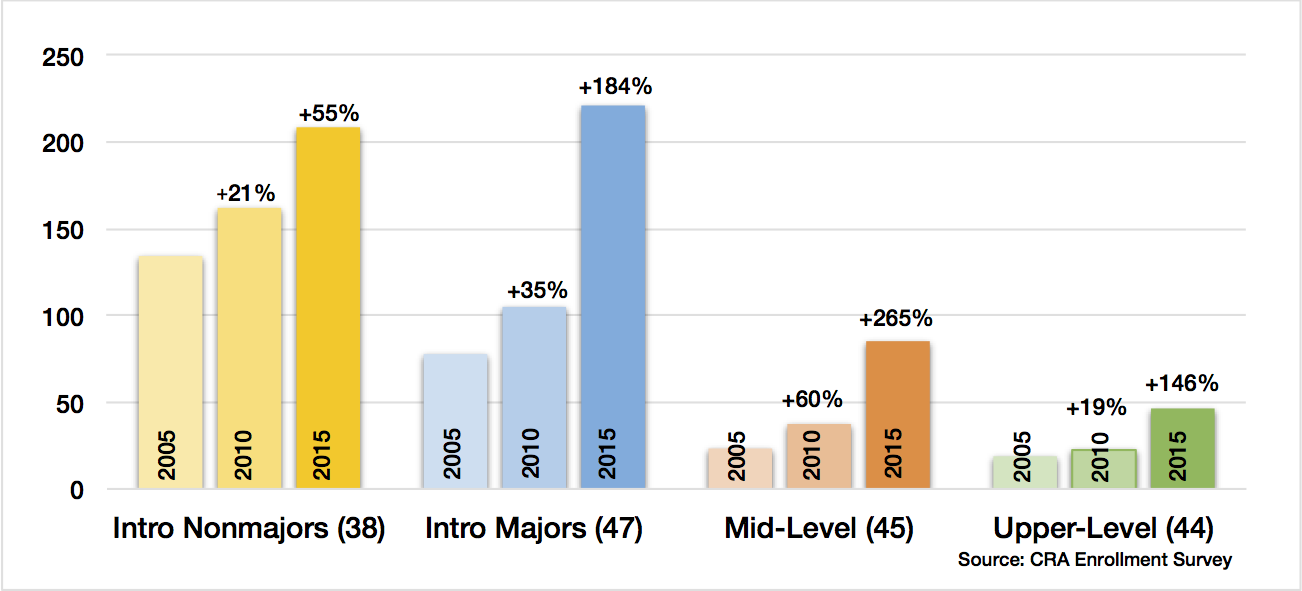
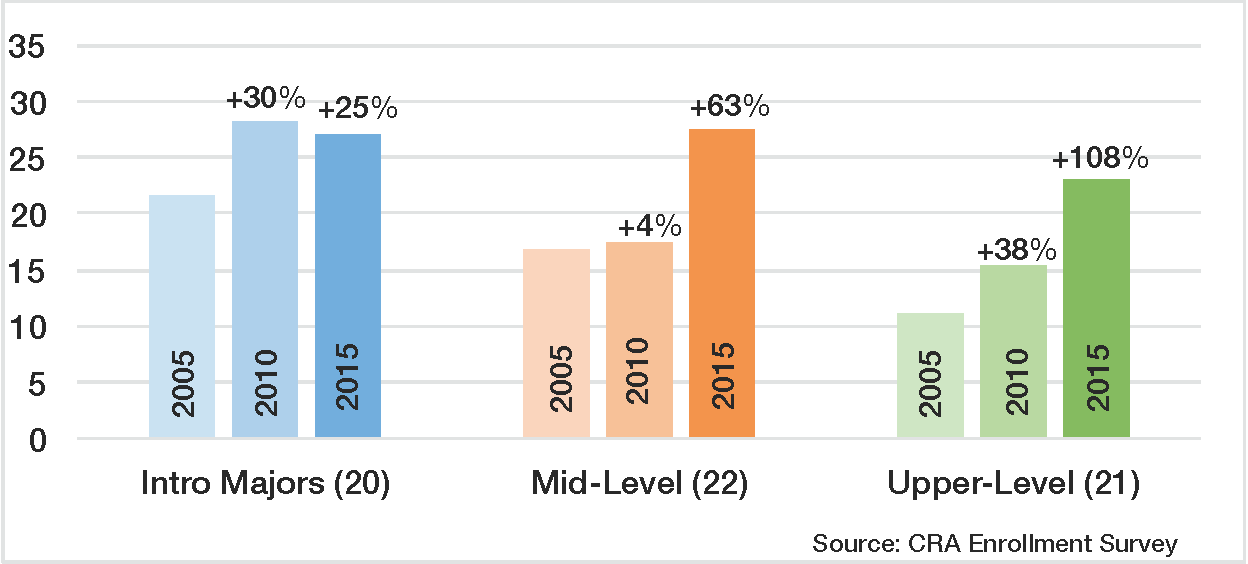
Figure C.2: Average enrollment by nonmajors in computing courses at doctoral- and non-doctoral granting units from 2005 to 2015. The number in parentheses in each category indicates sample size. (a) Doctoral-Granting Units (b) Non-Doctoral Granting Units.
D. The Mixed News on Diversity and the Enrollment Surge
Figure D.1: Median percentage of female students in the courses surveyed. (a) Doctoral-Granting Units (b) Non-Doctoral Granting Units.
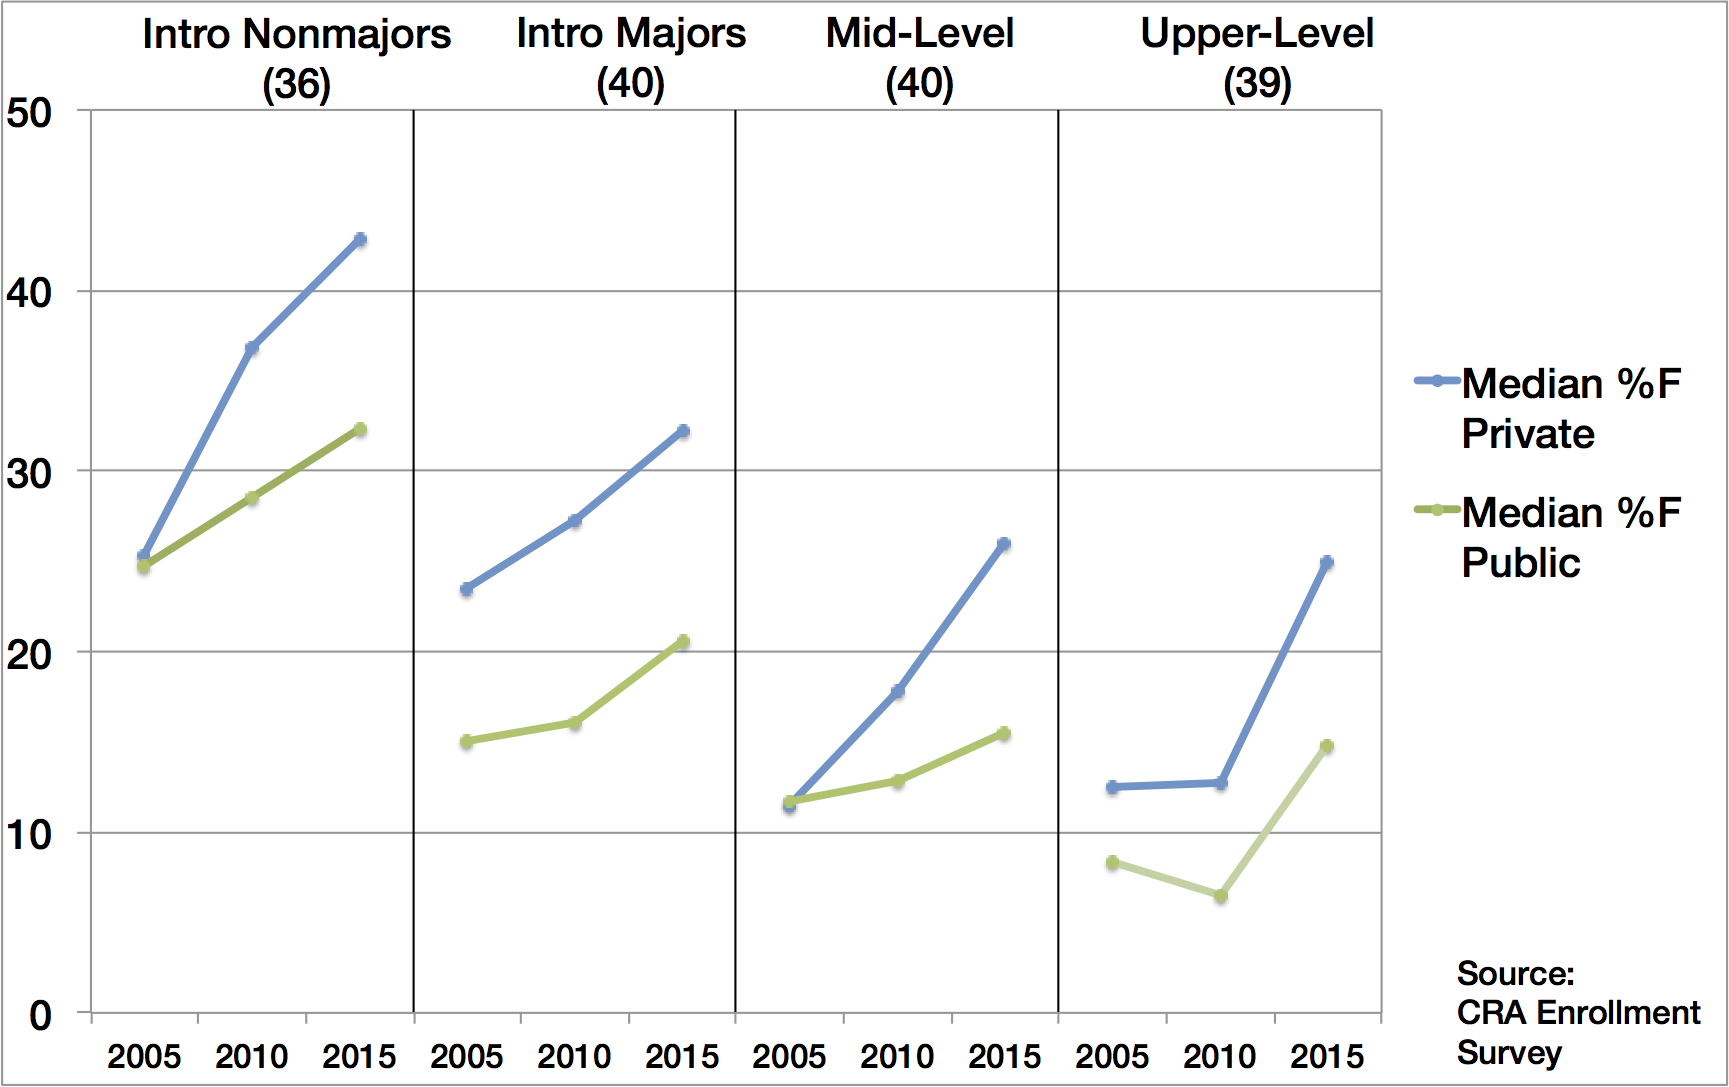
Figure D.2: Median percentage of female students in the courses surveyed in doctoral-granting units: public vs. private. Number in parentheses in each category indicates sample size.
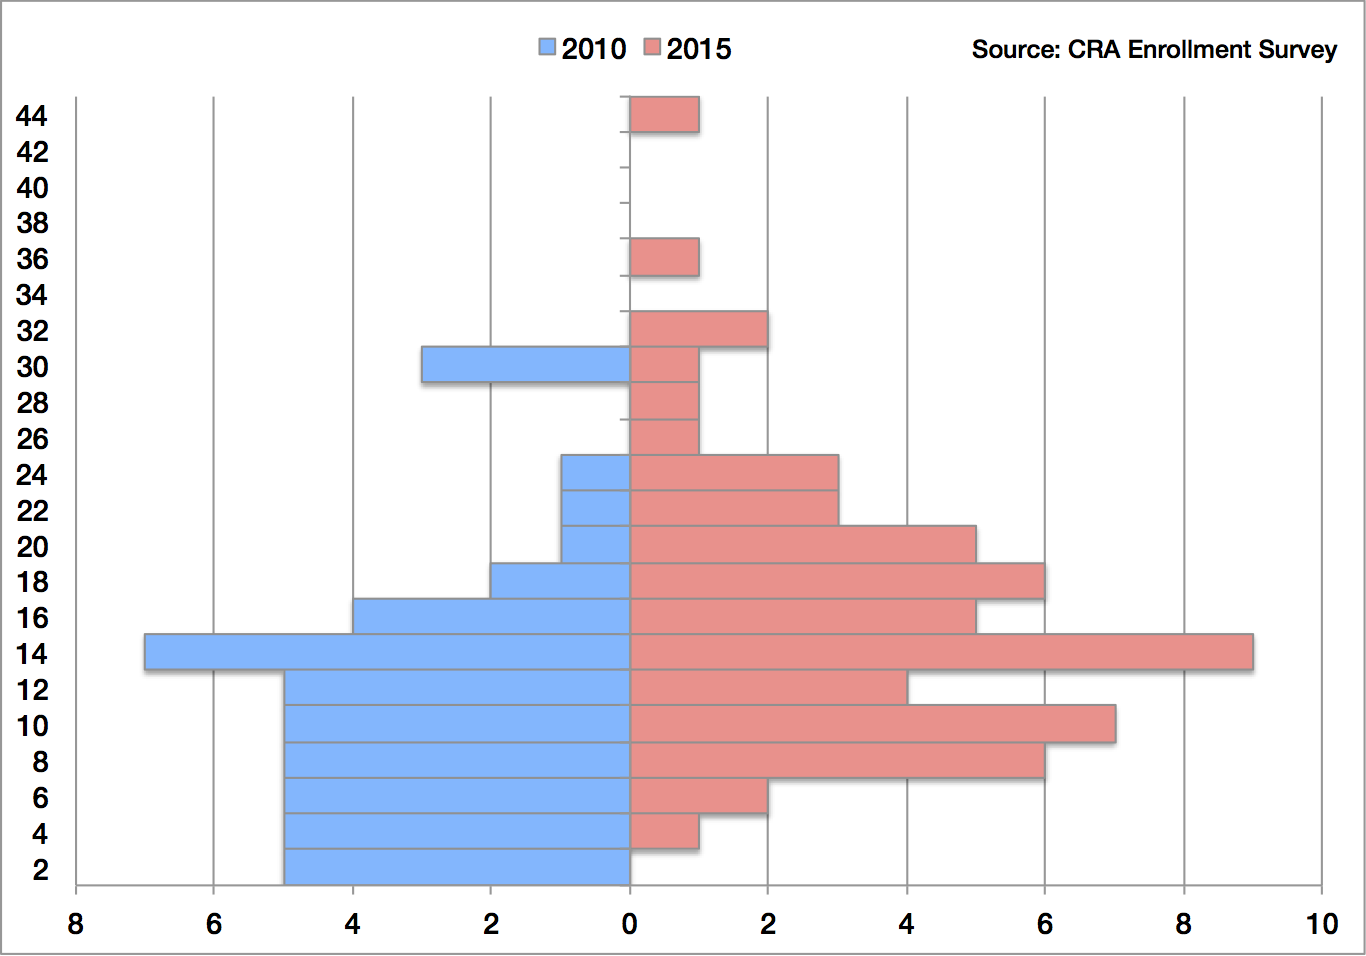
Figure D.3: Number of doctoral-granting units with indicated percentage of women in representative upper-level courses in 2010 and 2015.
Figure D.4: Number of URM students in four representative courses in doctoral-granting units.
Figure D.5: Median percentage of URM students in the courses surveyed (excluding MSIs). (a) Doctoral-Granting Units (b) Non-Doctoral Granting Units.
No percentage increase is shown for non-doctoral upper-level courses because the 2005 median was zero.
E. The Challenges of the Enrollment Surge for the Unit
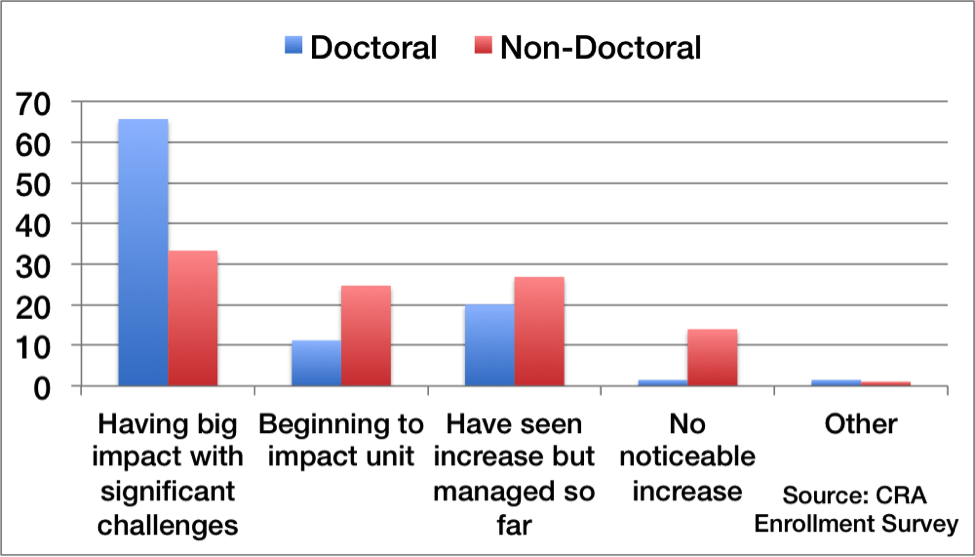
Figure E.1: Percentage of doctoral- and non-doctoral granting units experiencing a given level of impact.
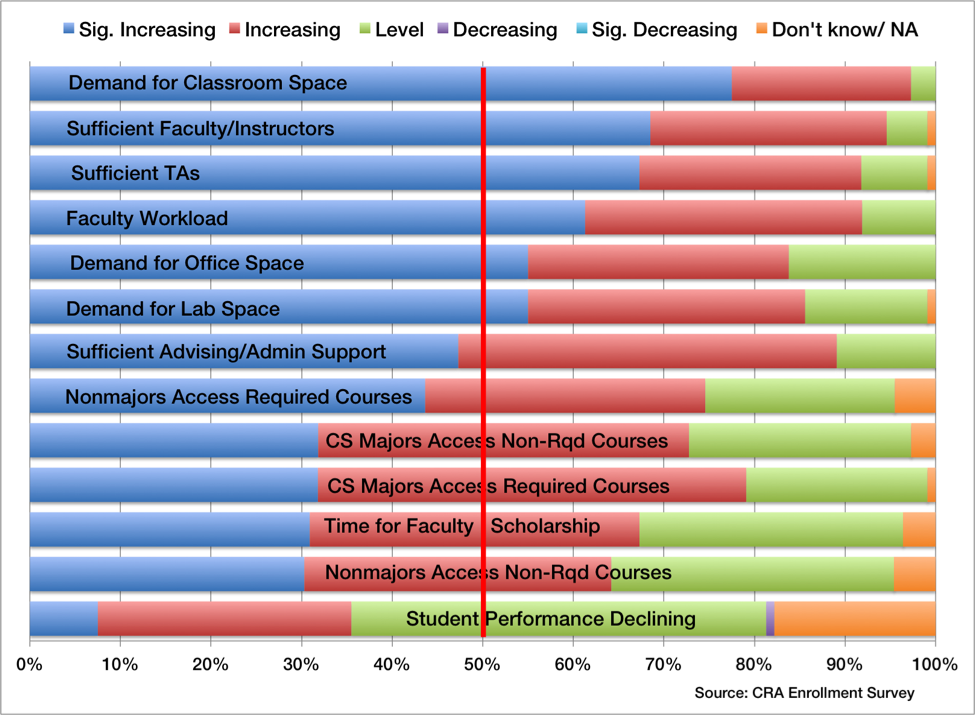
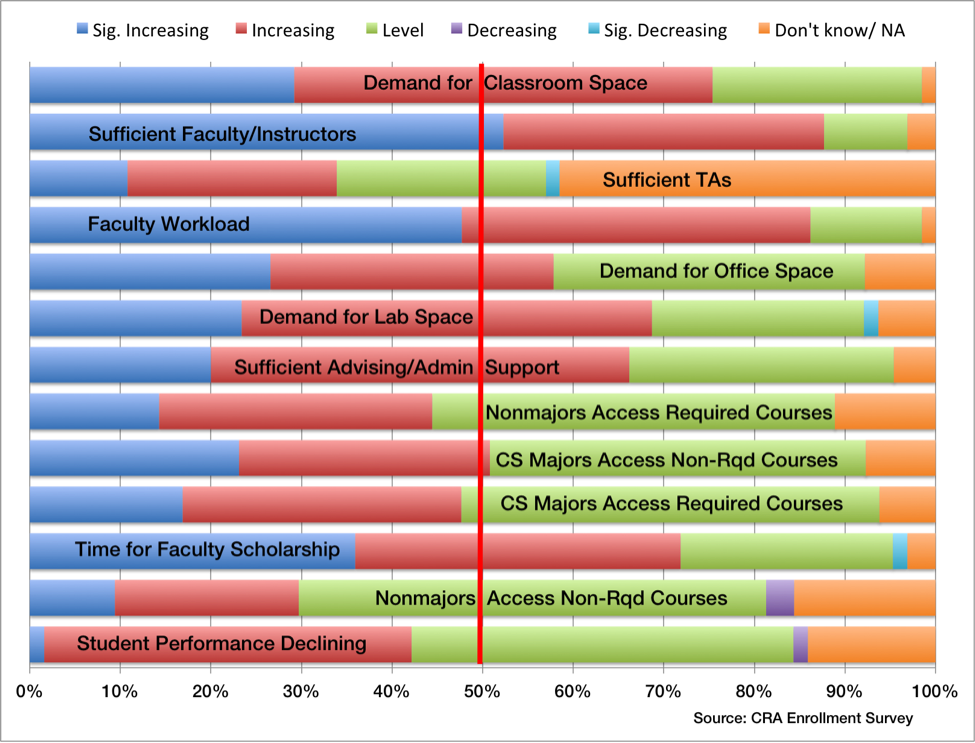
Figure E.2: Percentage of units stating whether a given problem or concern exists at their unit due to increasing enrollment. (a) Doctoral-Granting Units (b) Non-Doctoral Granting Units.
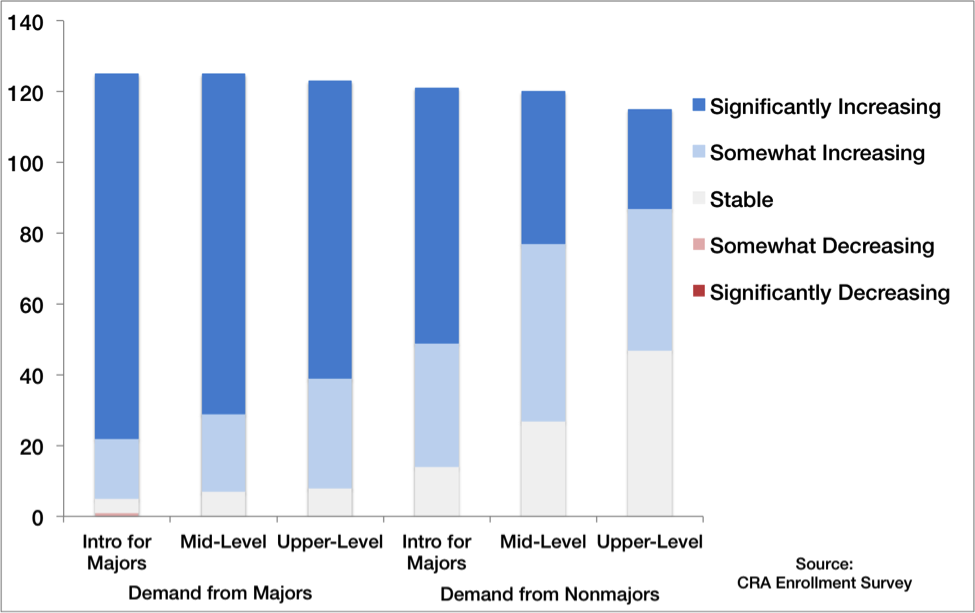
Figure E.3: Number of doctoral-granting units reporting levels of increased demand from majors and nonmajors by course level.
F. Units’ Response to Surging Enrollments
Figure F.1: Enrollment related actions taken by units. (a) Doctoral-Granting Units (b) Non-Doctoral Granting Units.
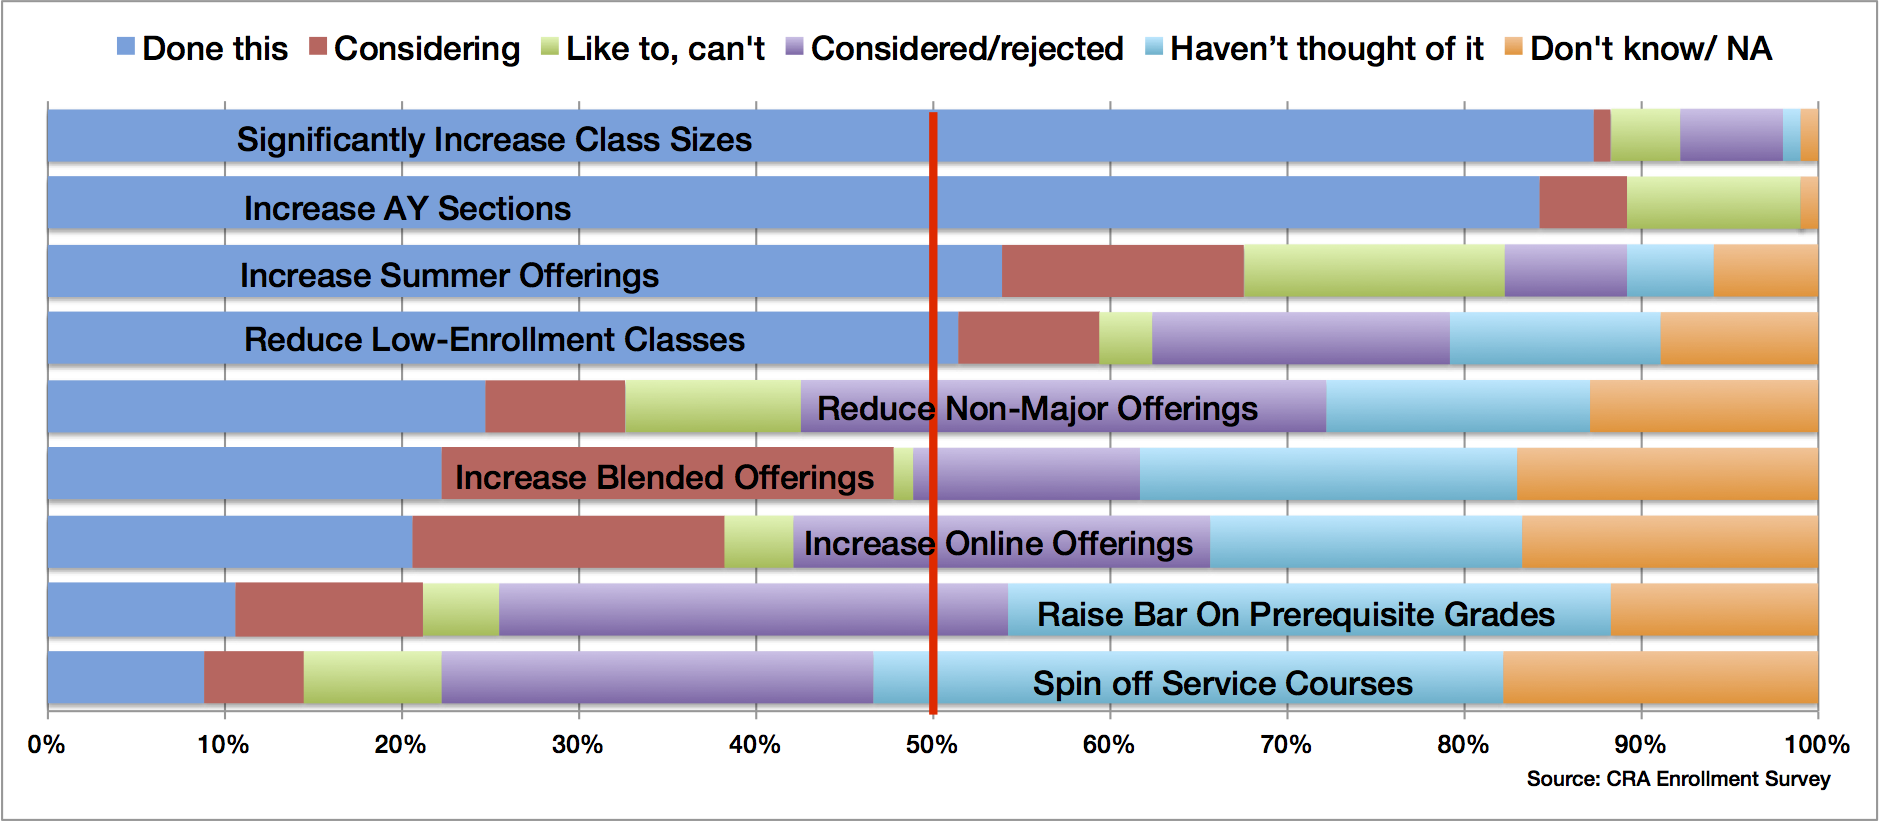
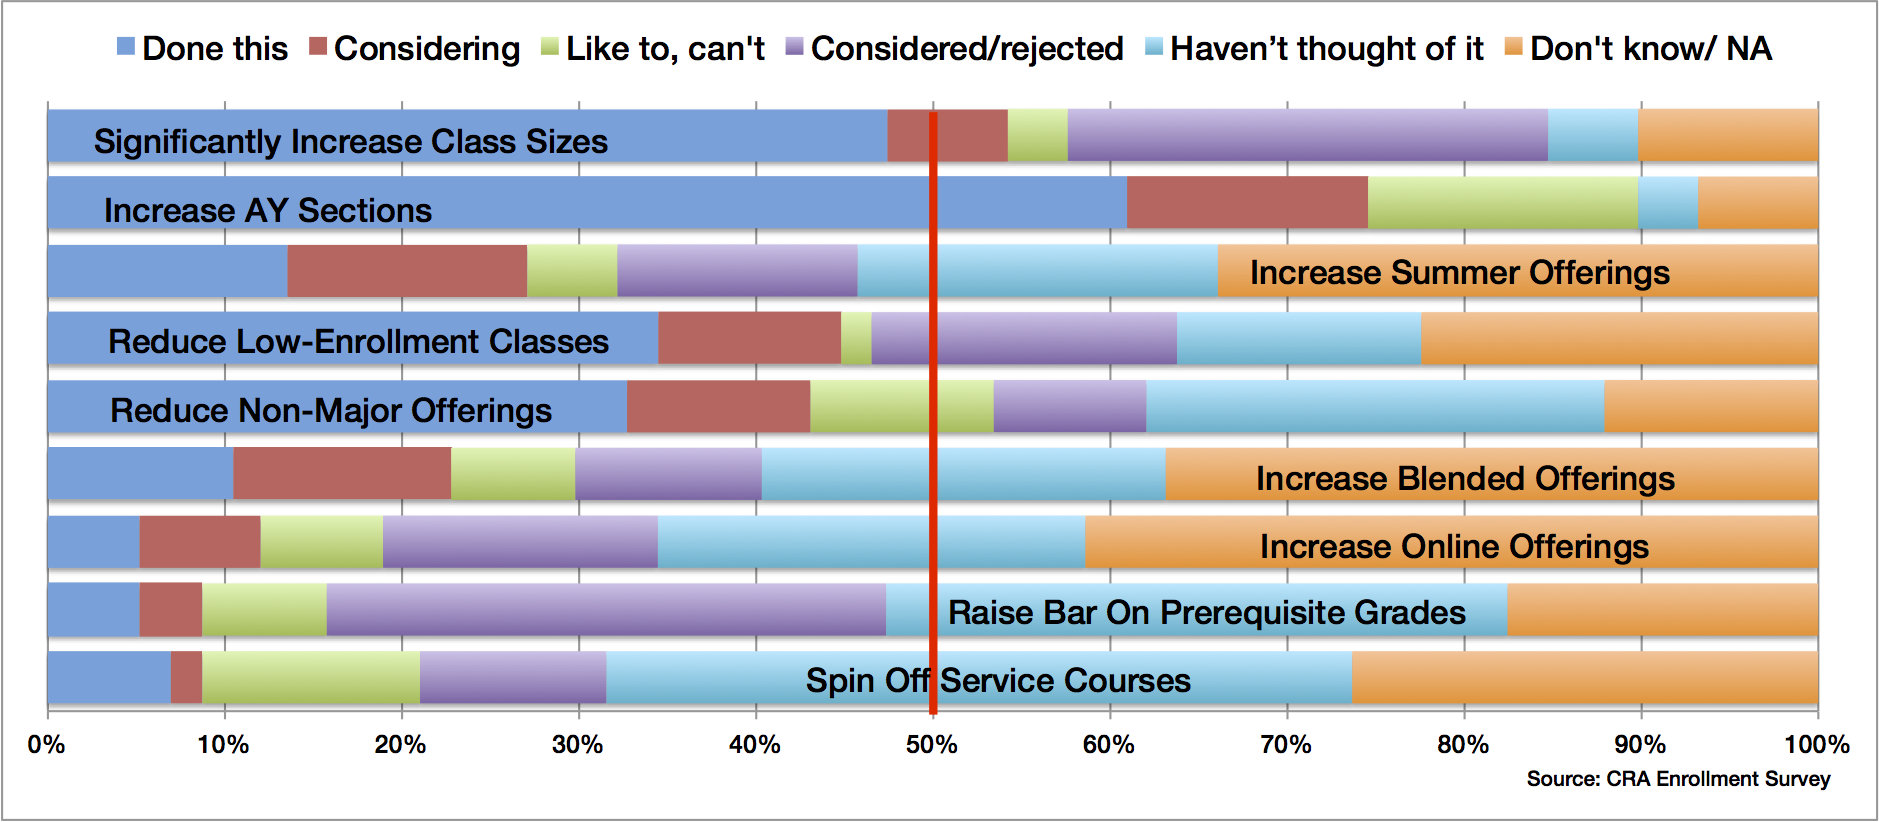
Figure F.2: Actions taken to manage course size and enrollments. (a) Doctoral-Granting Units (b) Non-Doctoral Granting Units.
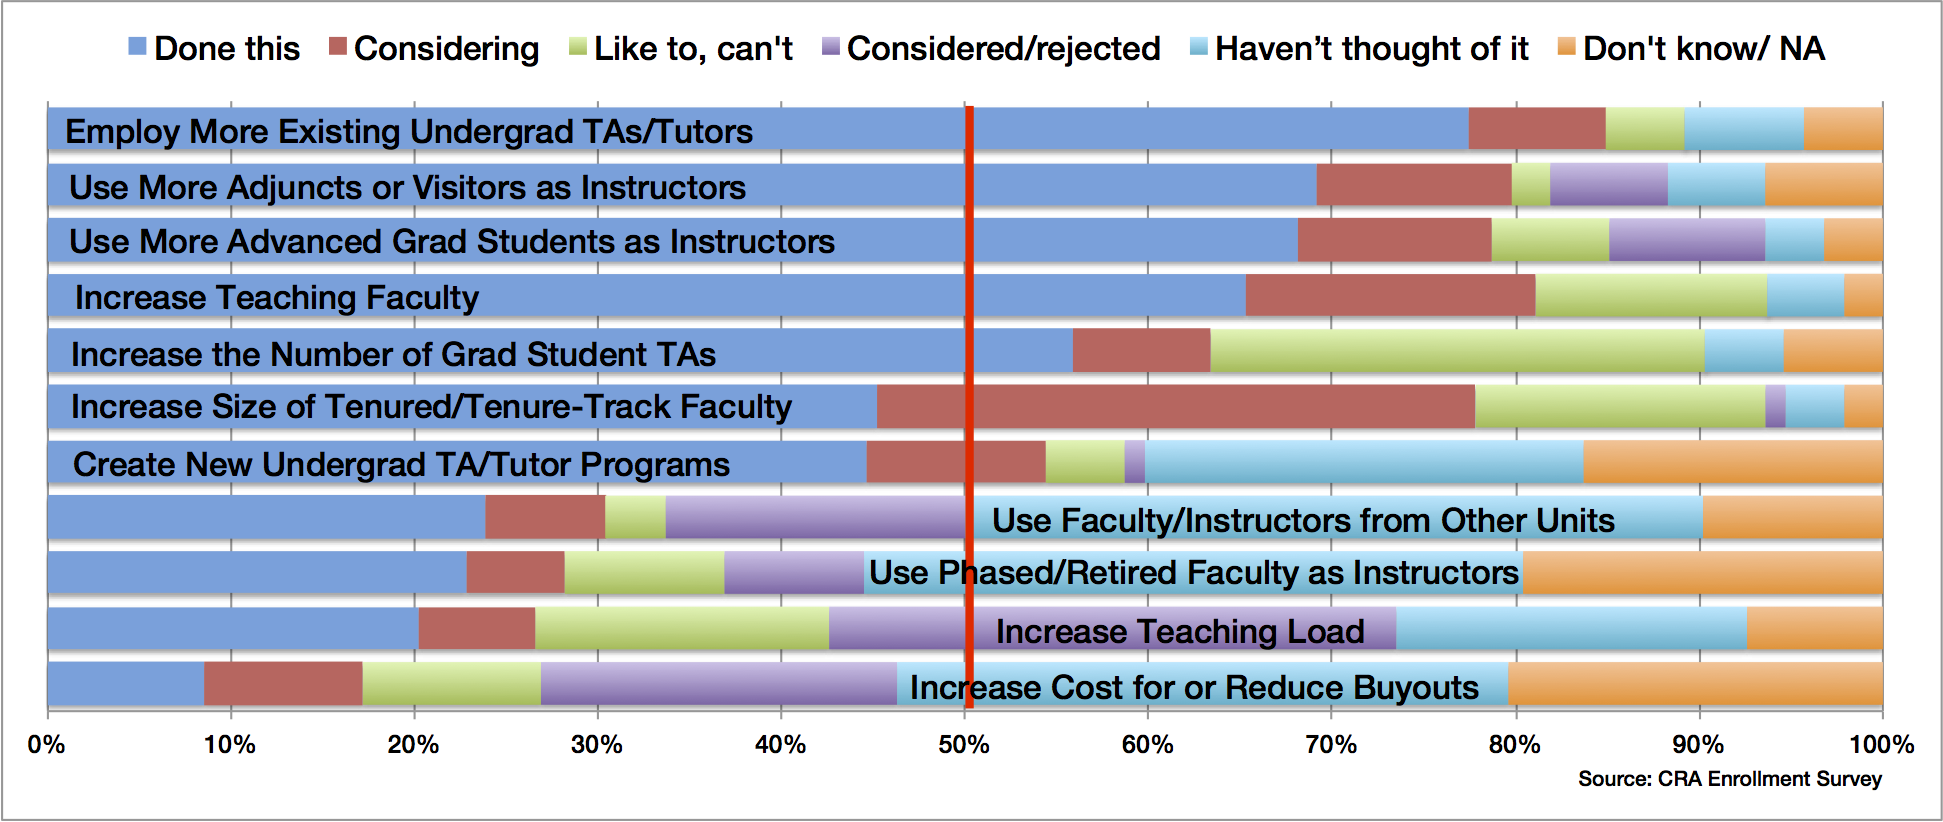
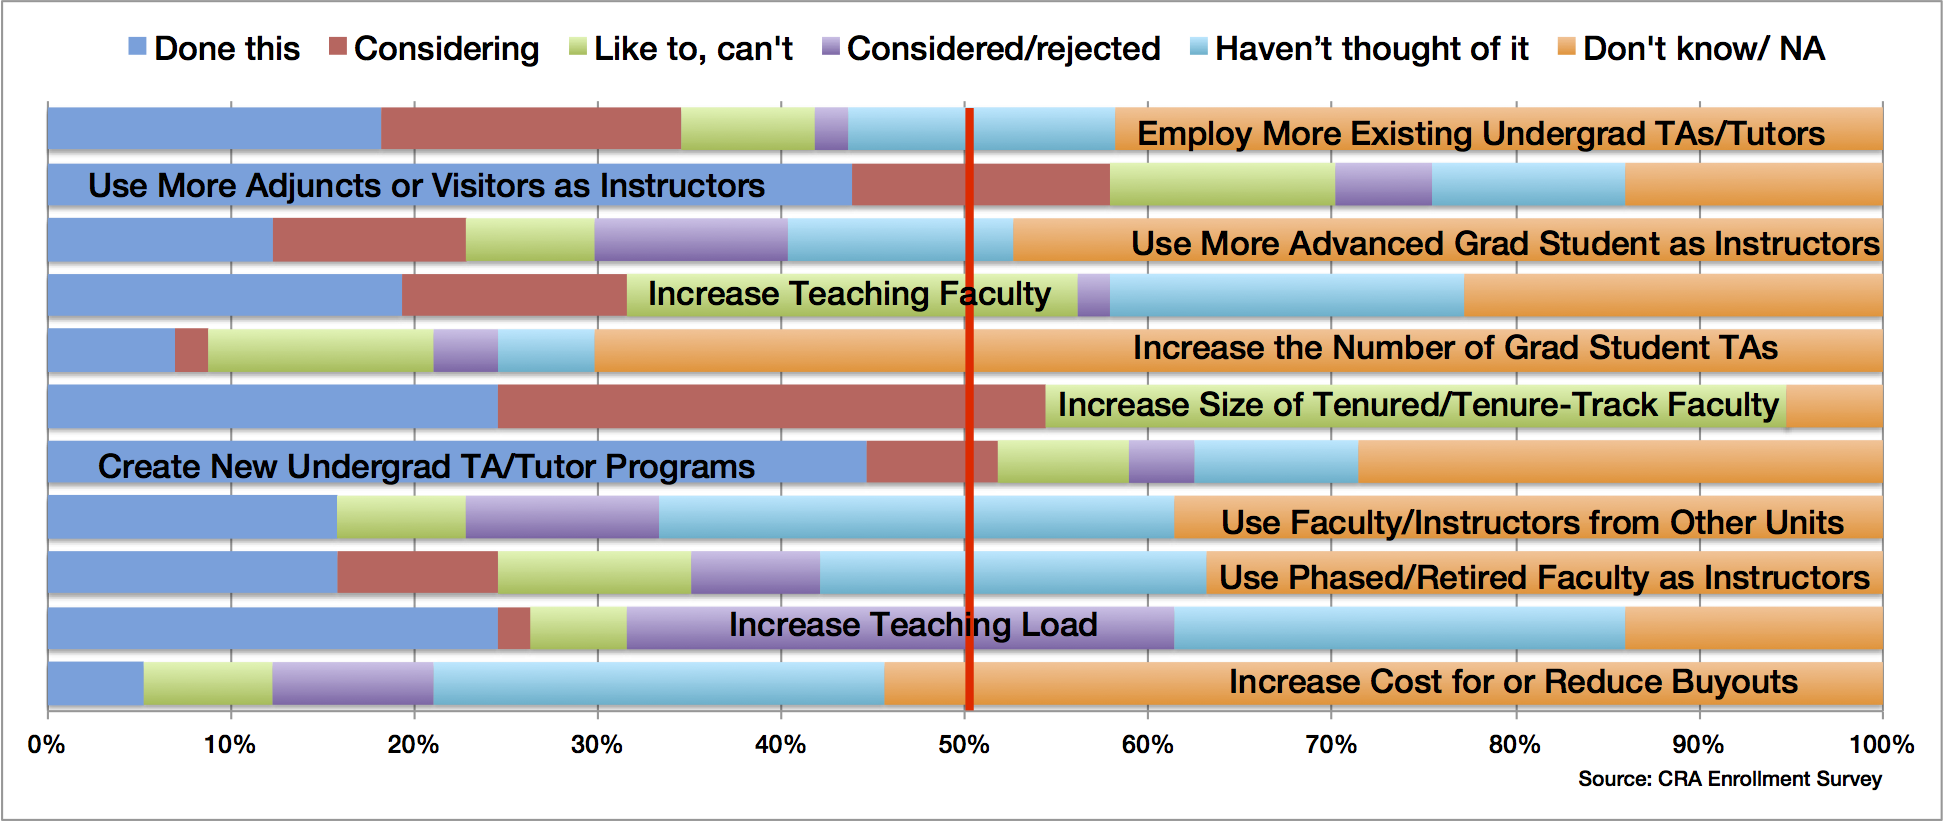
Figure F.3: Actions taken to manage teaching resources. (a) Doctoral-Granting Units (b) Non-Doctoral Granting Units.
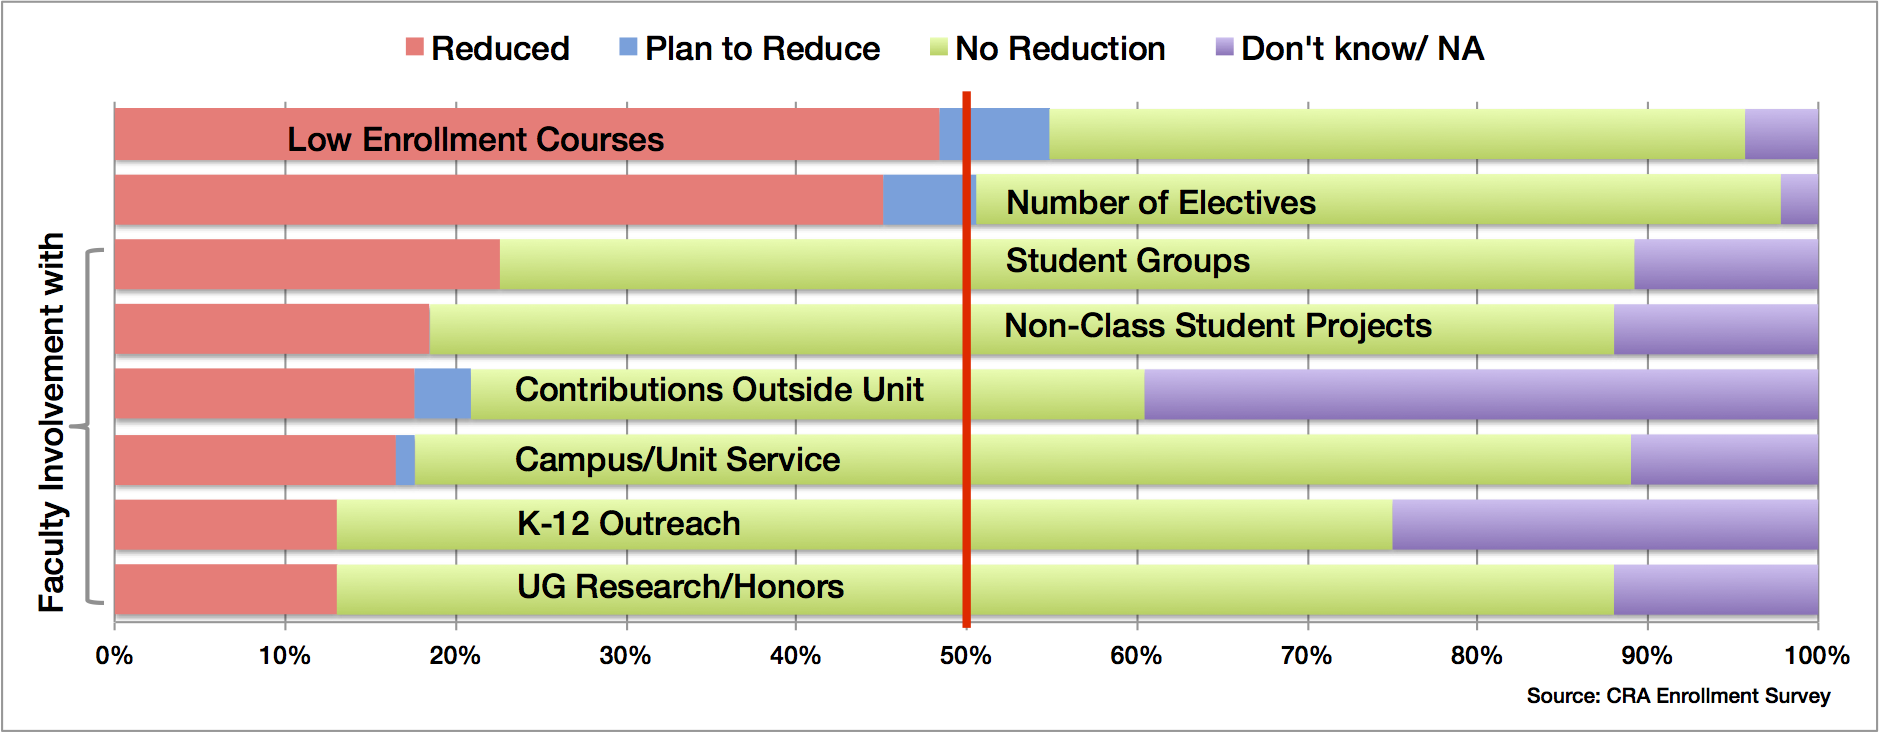
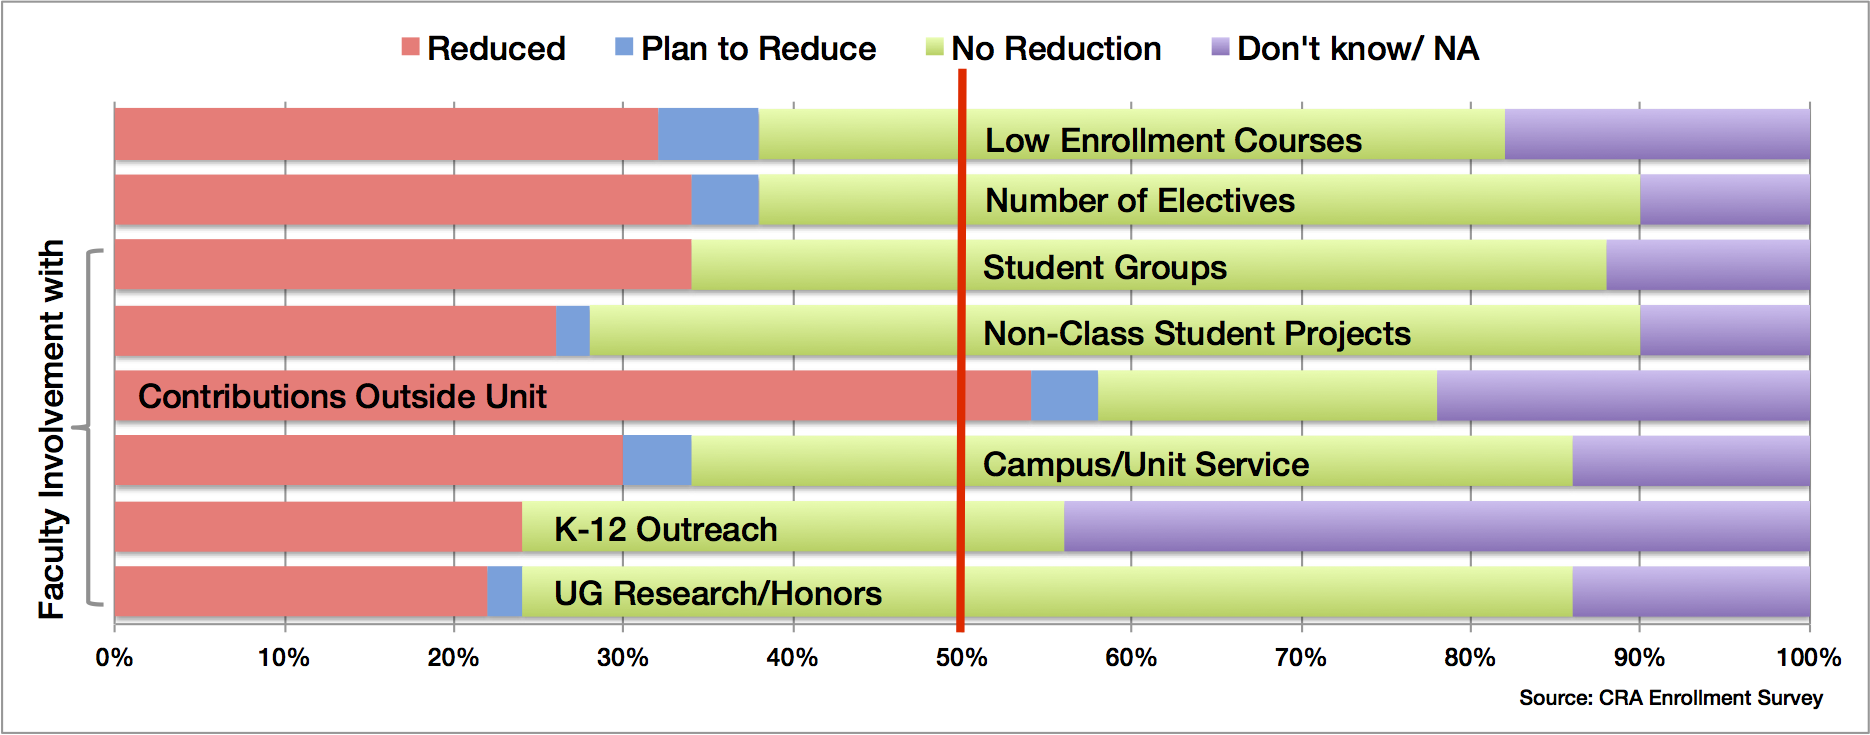
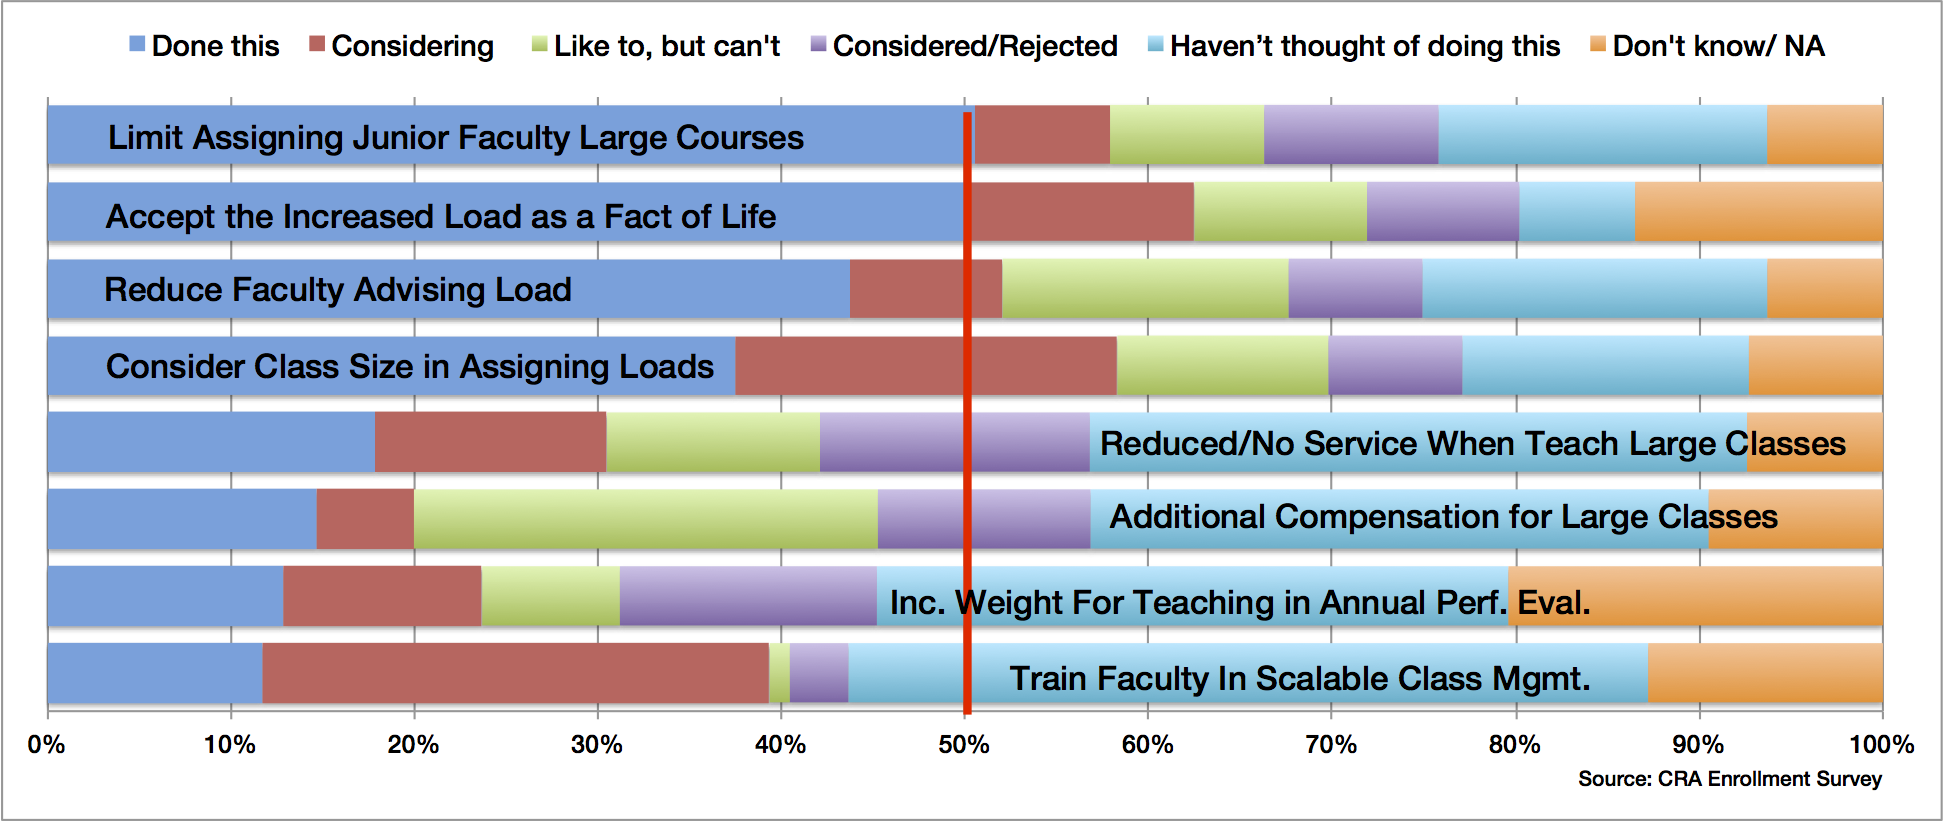
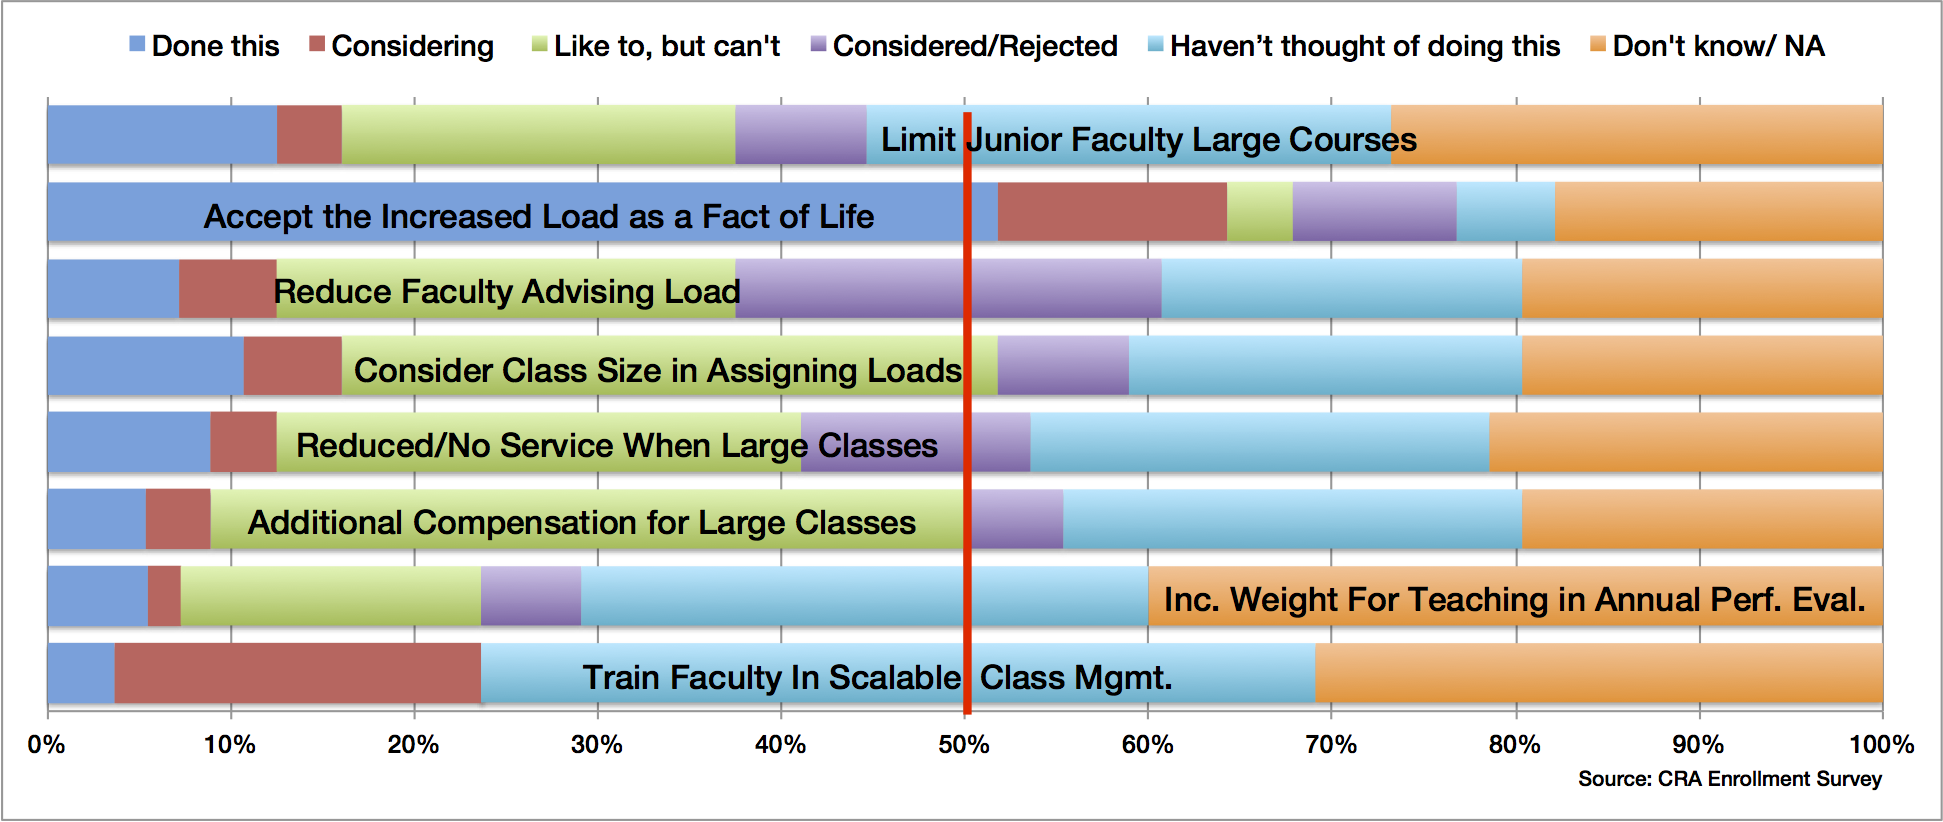
Figure F.4: Actions taken to manage faculty workloads. (a) Doctoral-Granting Units (b) Non-Doctoral Granting Units.
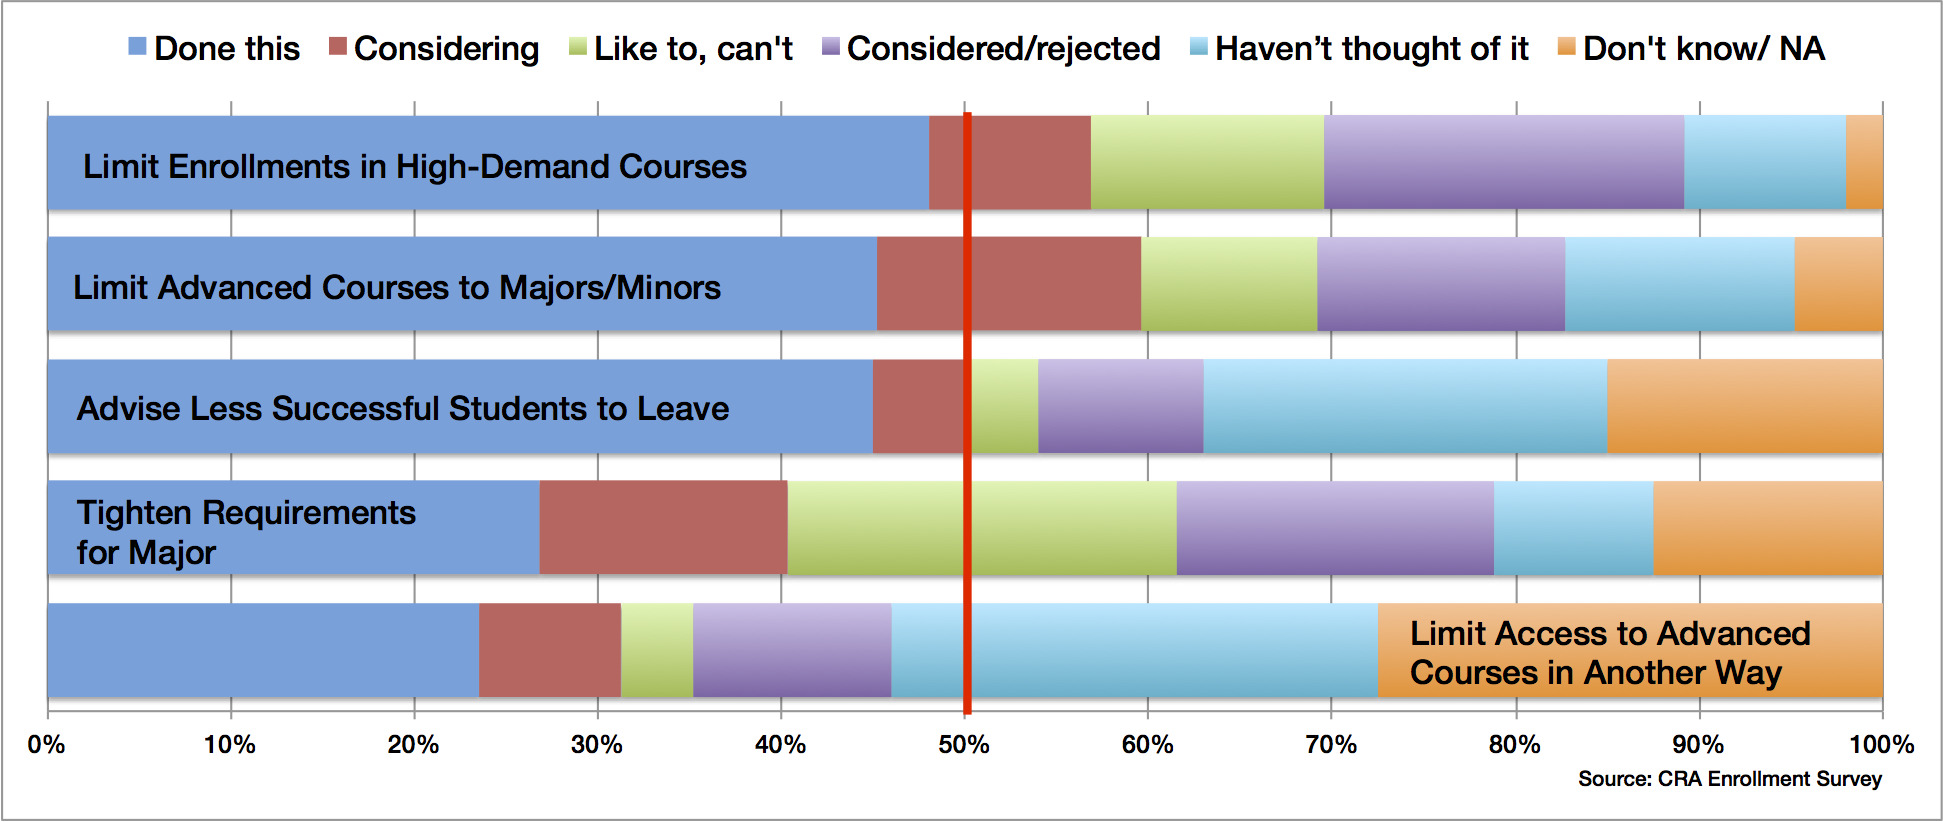
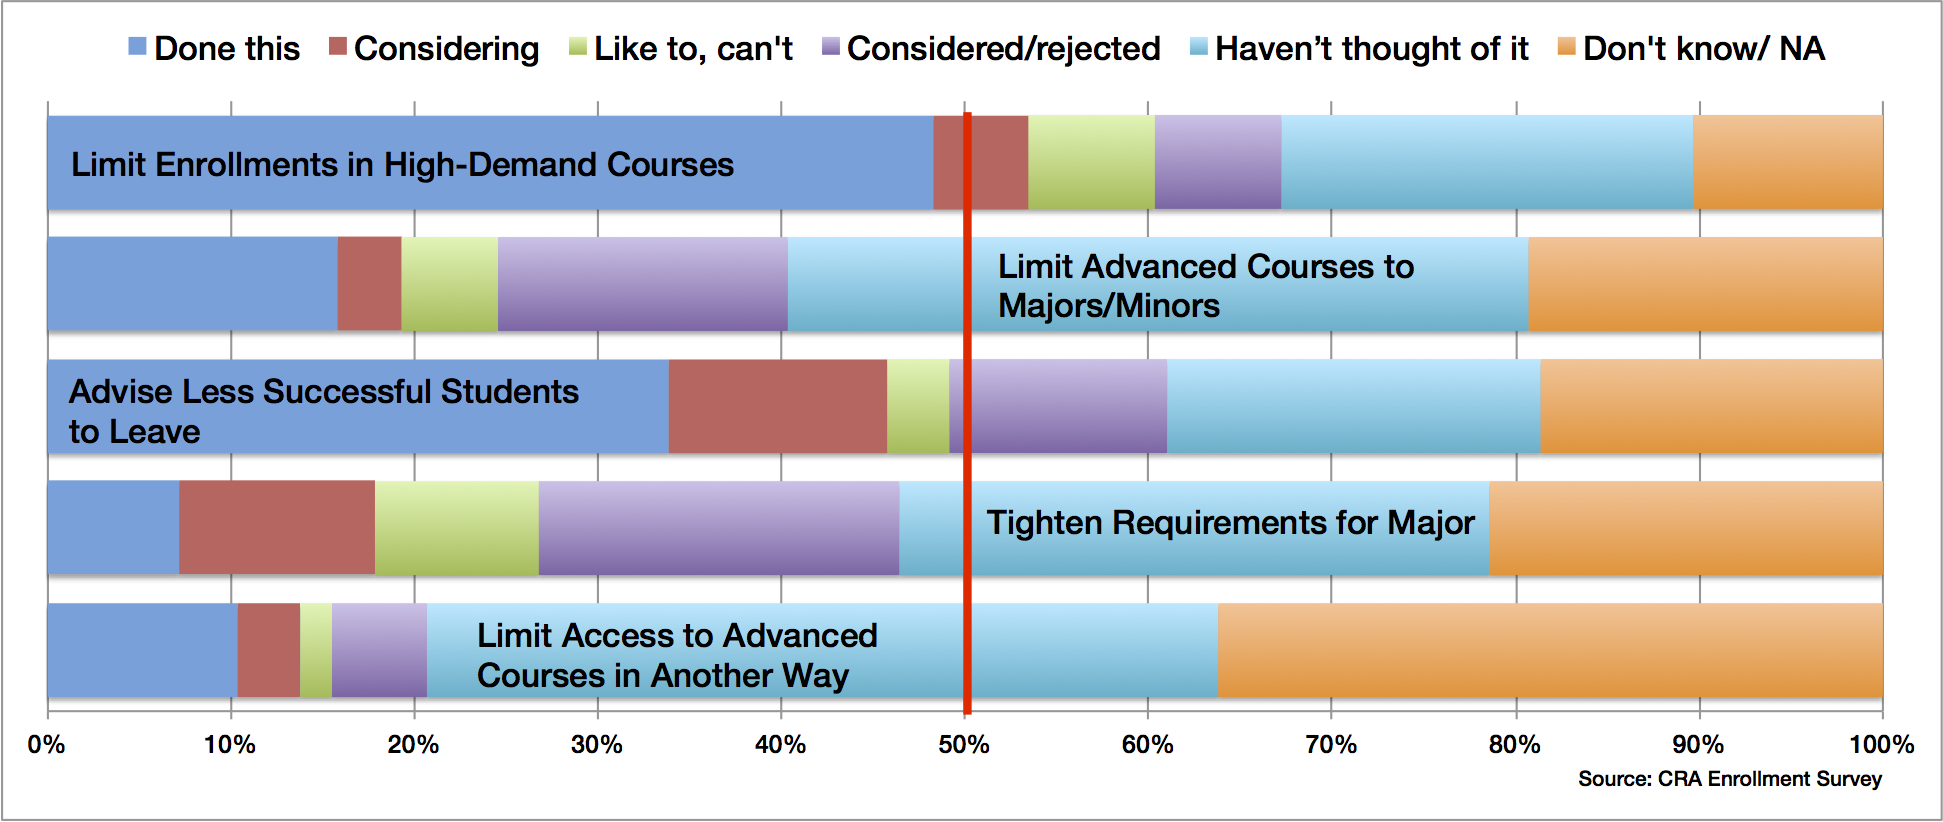
Figure F.5: Actions taken to manage access to courses or major (a) Doctoral-Granting Units (b) Non-Doctoral Granting Units.
G. IPEDS Comparisons
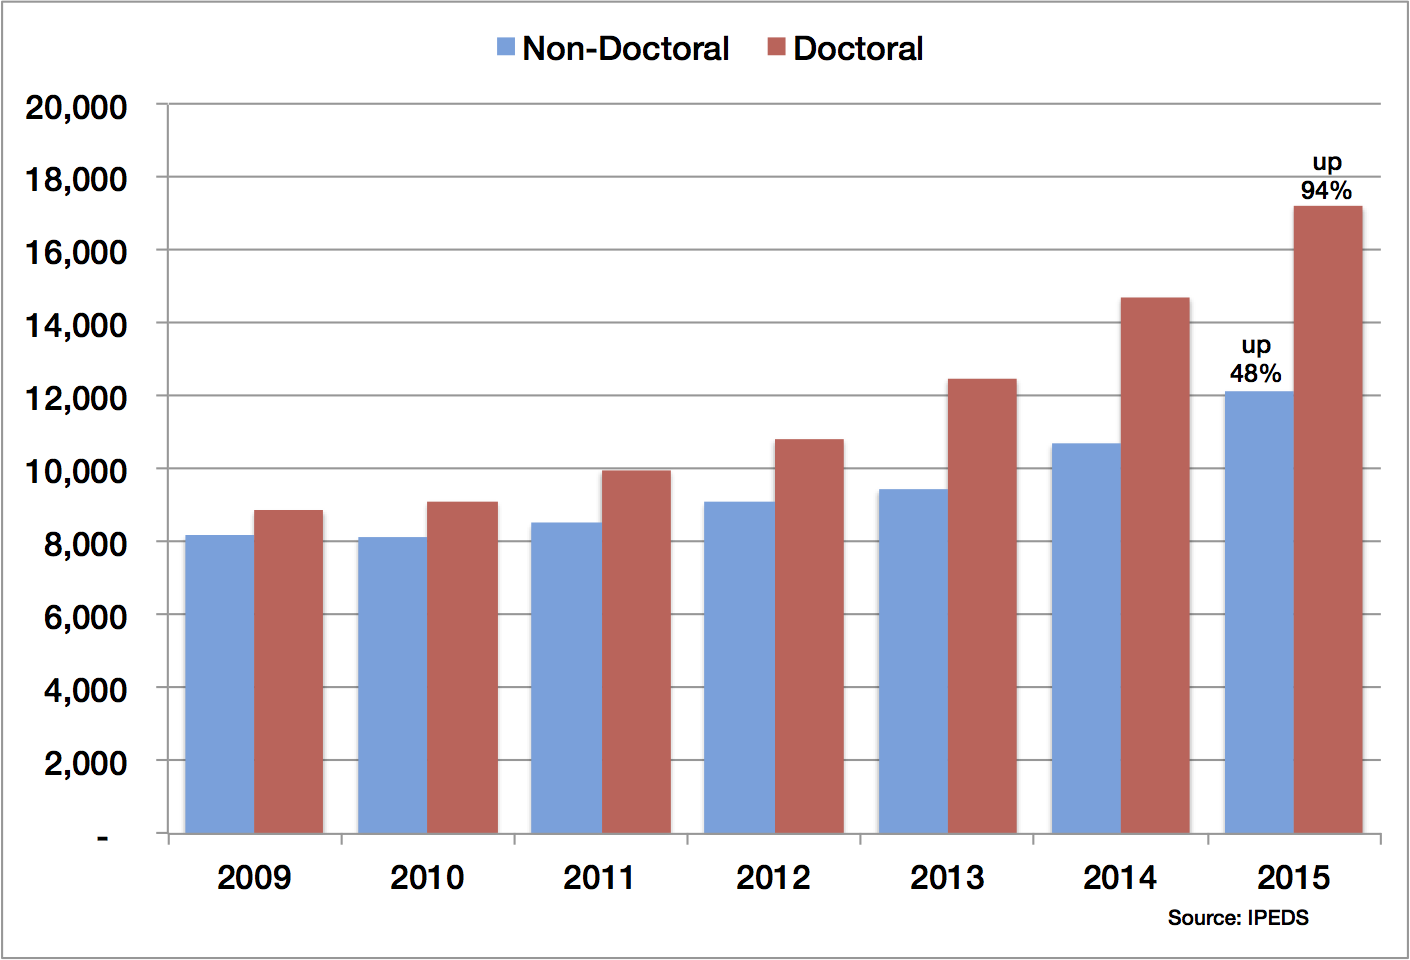
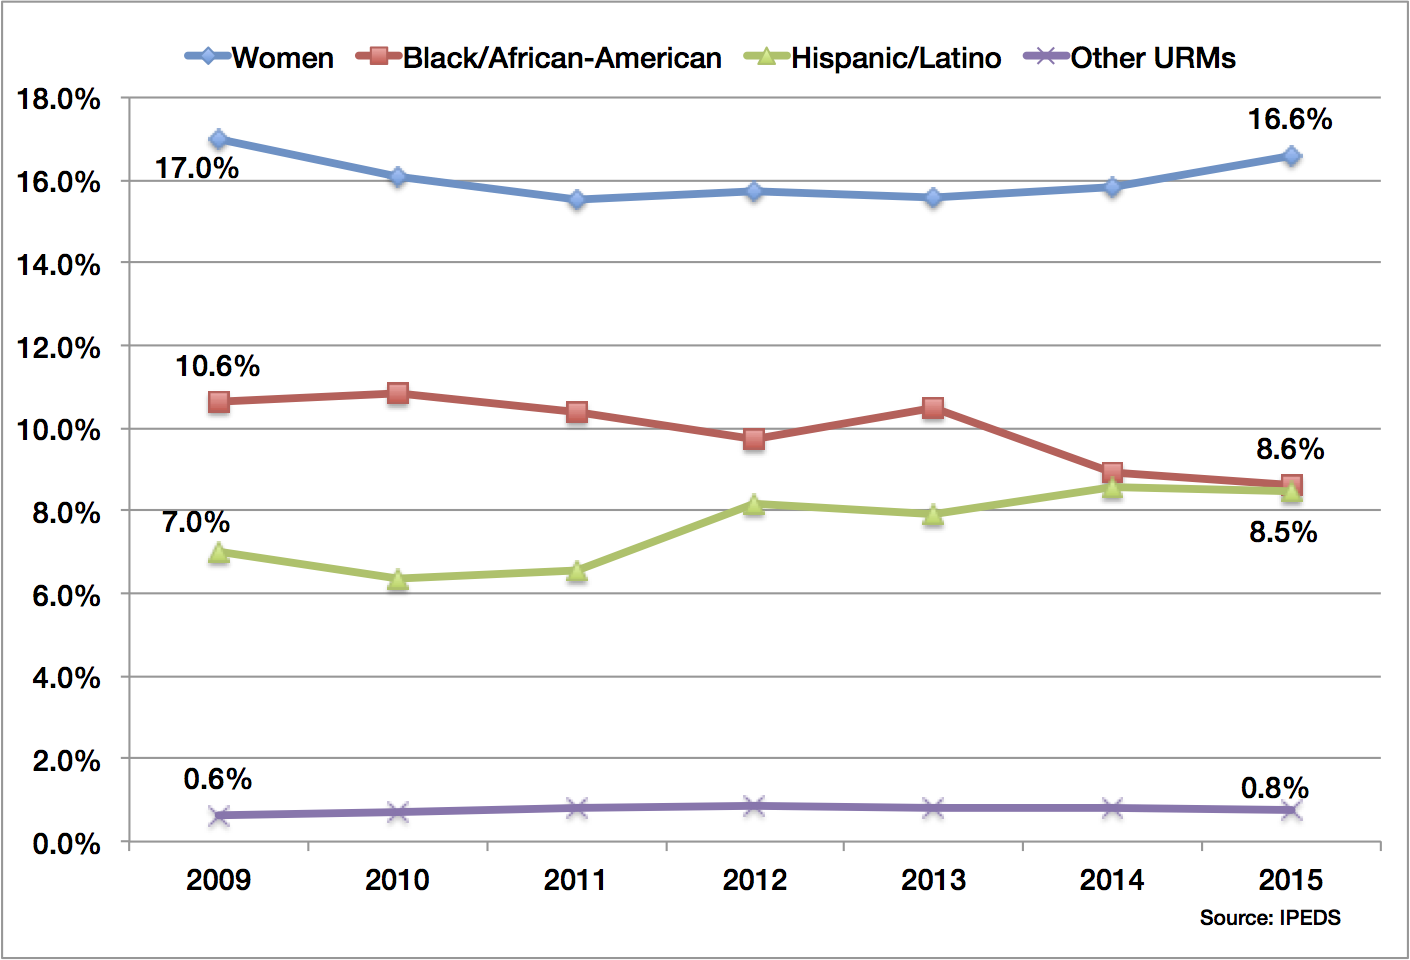
Figure G.1: IPEDS Data (CIP 11.0101 & 11.0701)
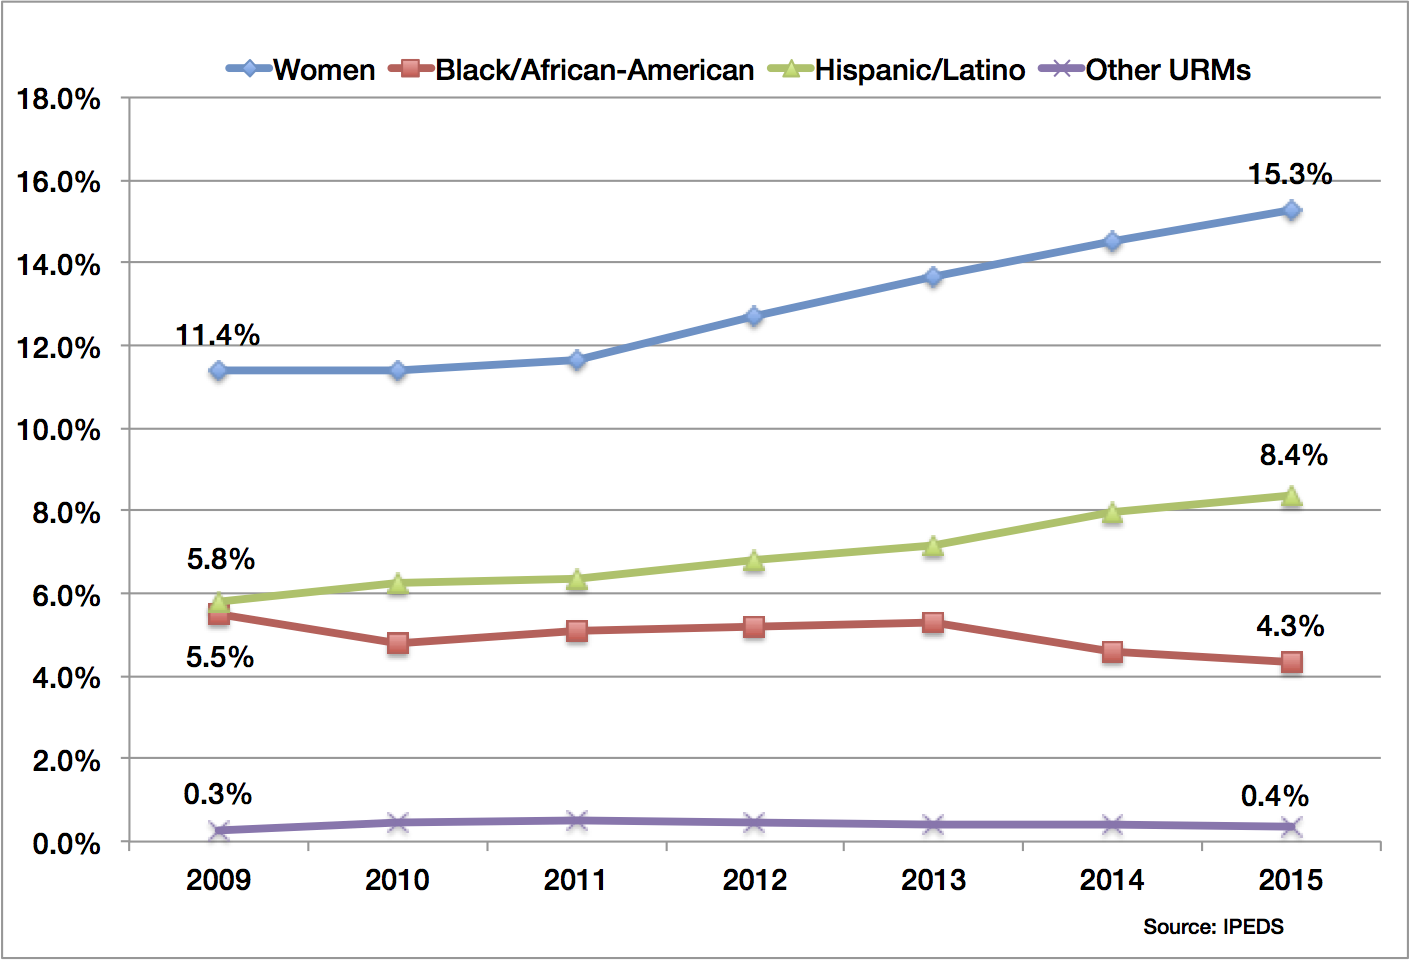
Figure G.2: IPEDS CS Diversity Data. (a) Doctoral-Granting Units (b) Non-Doctoral Granting Units.
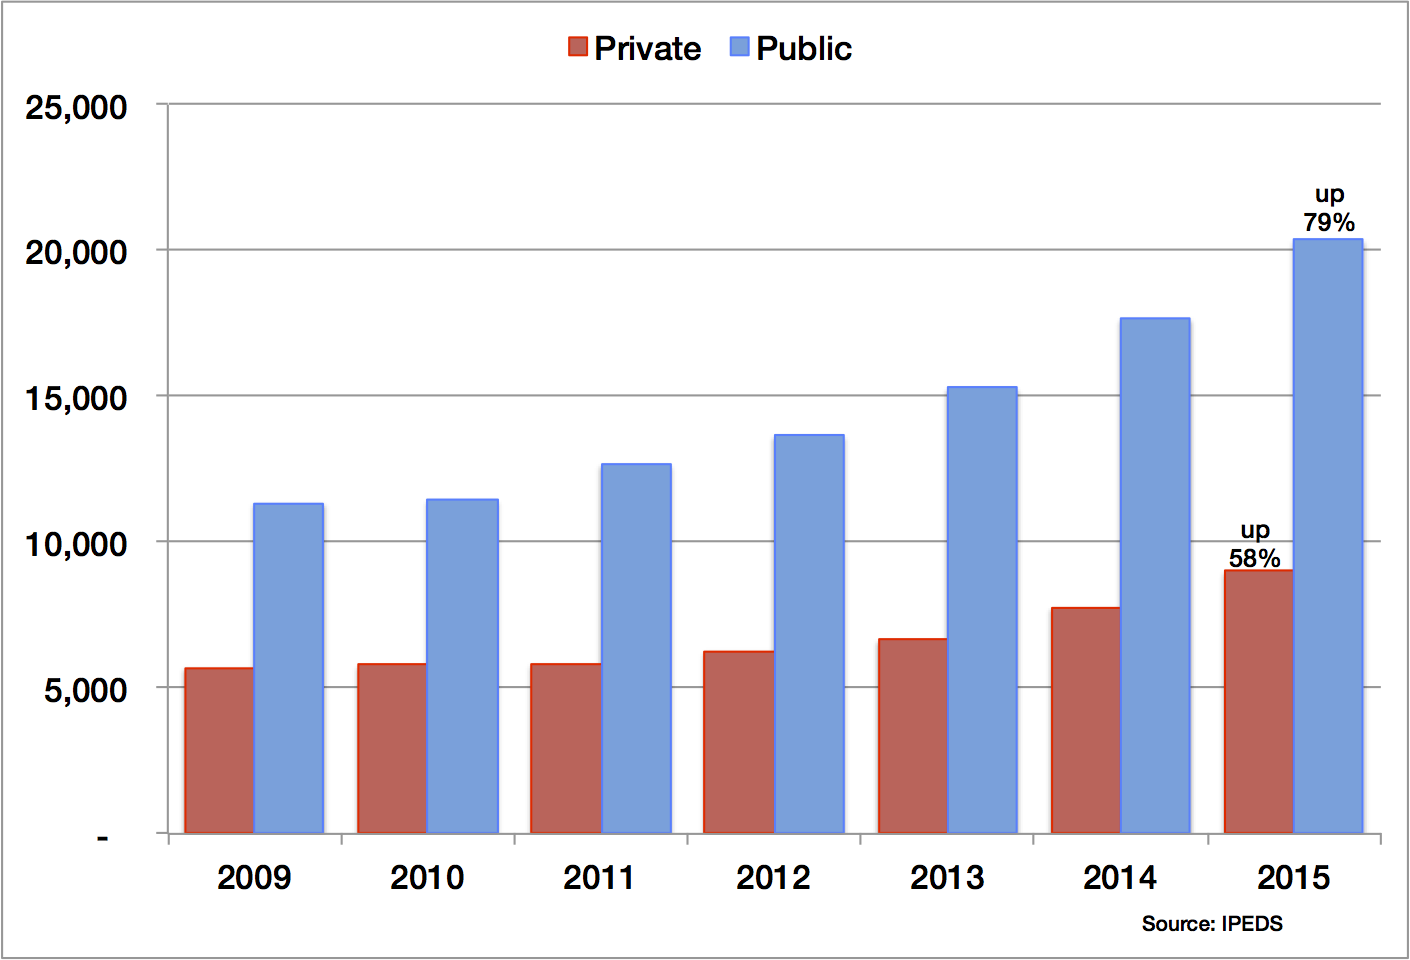
Figure G.3: IPEDS Private vs. Public CS Completions
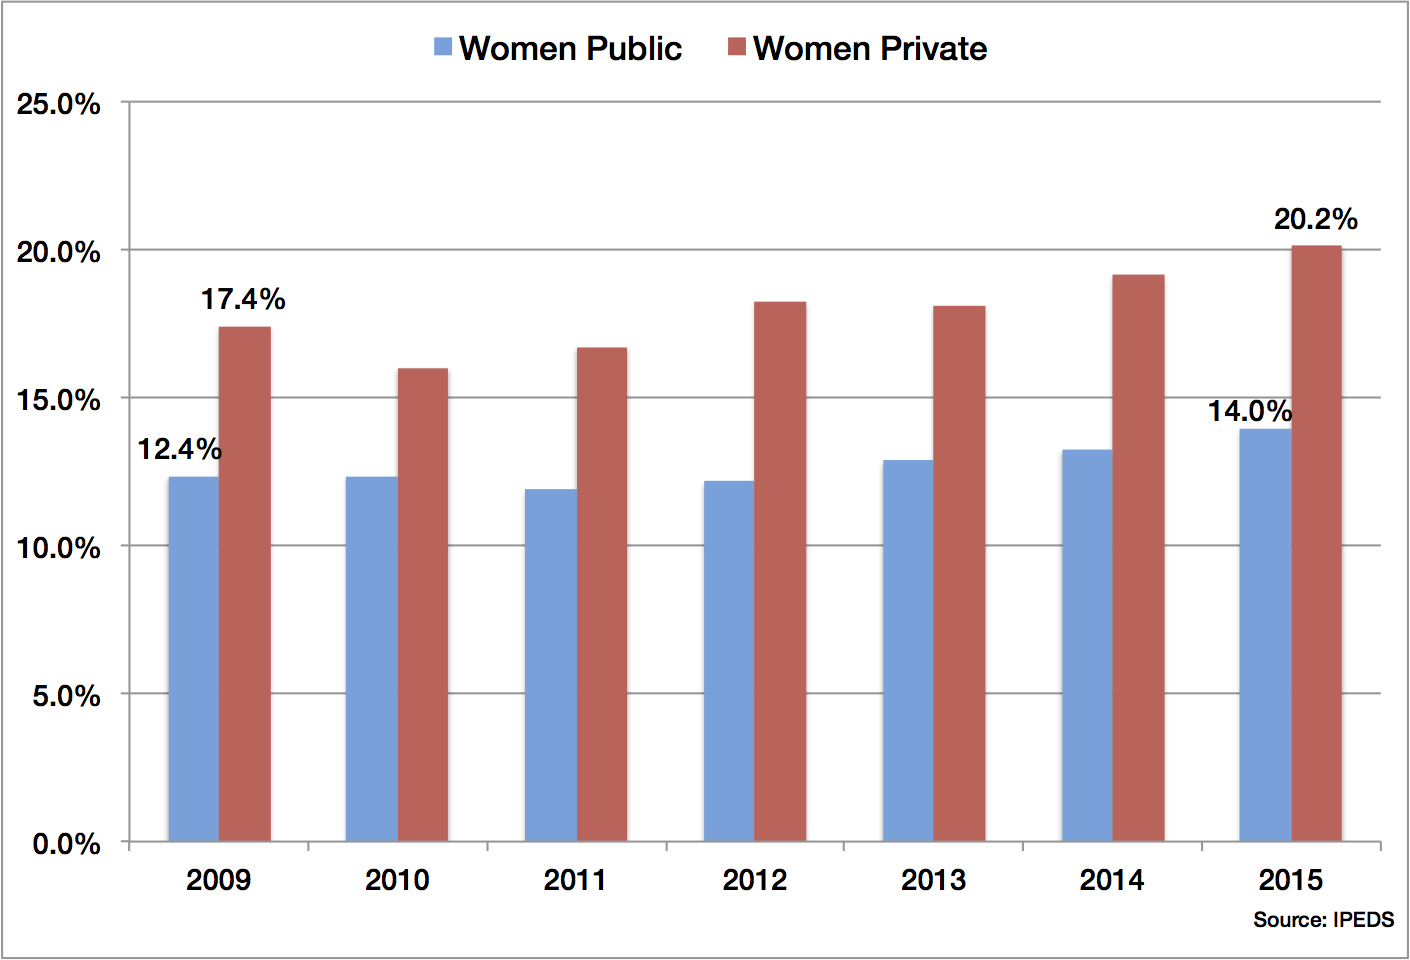
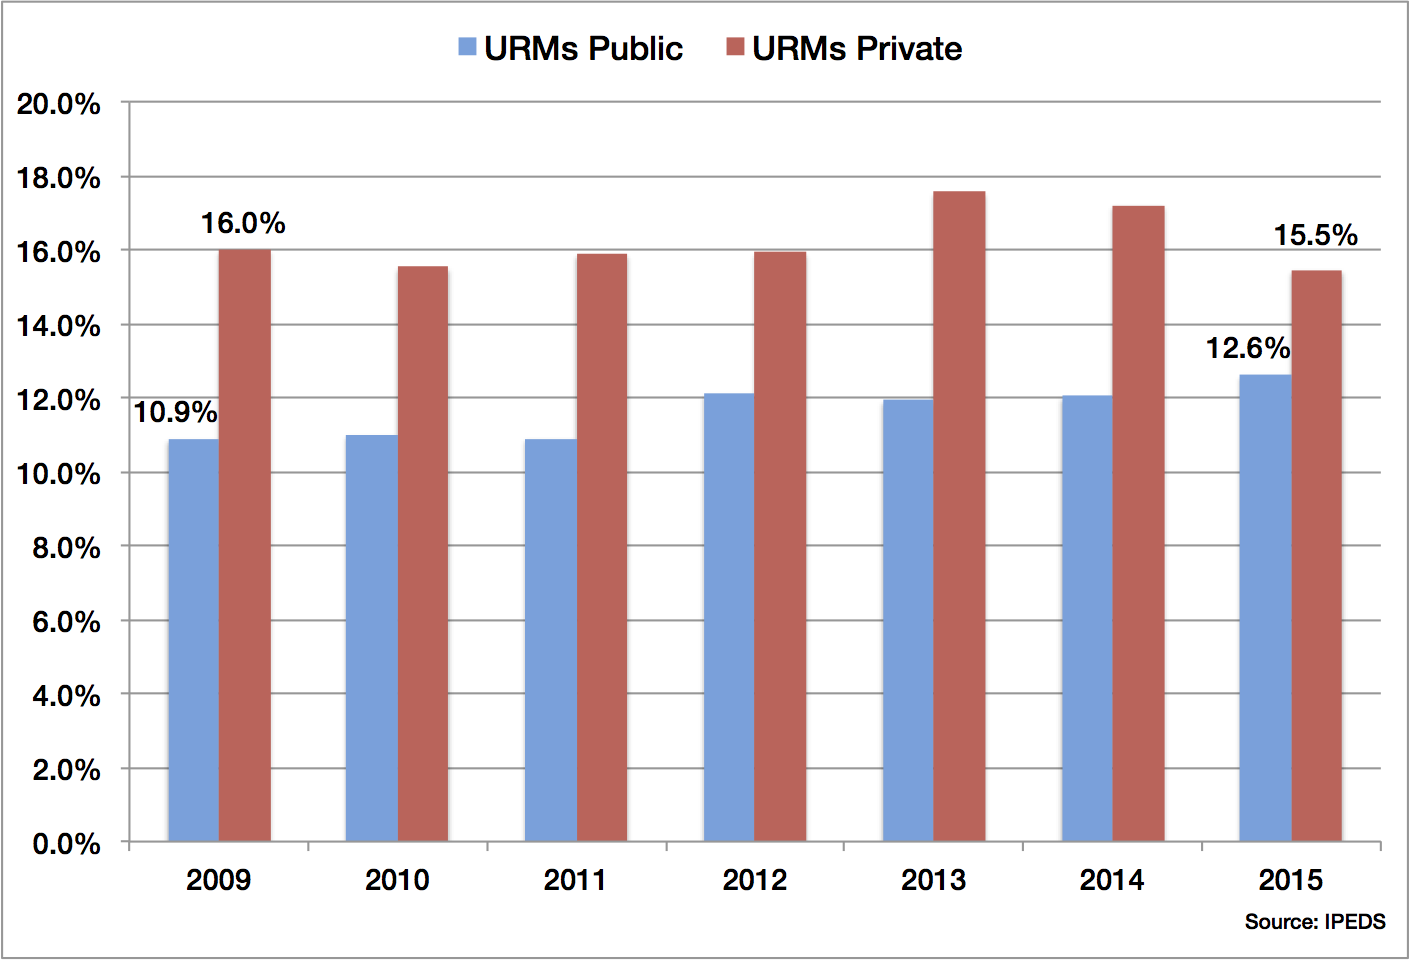
Figure G.4: Diversity in Public and Private Institutions. (a) Doctoral-Granting Units (b) Non-Doctoral Granting Units.
H. Appendix: Methodology
No Figures
I. Appendix: List of Figures
No Figures
J. Acknowledgements
No Figures
