US CS New Majors, Enrollment Both Continue Increase in 2008-2009
 CRA’s Taulbee Survey of Ph.D.- granting Computer Science (CS) and Computer Engineering departments in North America has been conducted annually since 1974. Results from the most recent survey will be provided to participants and CRA members in early March. They will be published on CRA’s website (http://www.cra.org/statistics/) and in Computing Research News in May. Due to widespread interest, CRA releases data on undergraduate degrees early.
This article reports on CS bachelor’s degree enrollments and production among Ph.D.-granting departments in the United States since the late 1990s. Data are reported in both total numbers and medians per department as the latter helps limit the effect of variation in response rates. Results from the Taulbee Survey should be compared with data produced by the National Science Foundation (NSF), which surveys all institutions that grant CS degrees (whereas Taulbee is a survey of the doctorate-granting departments only). NSF’s most recent data are from academic year 2006/2007. 1
According to HERI/UCLA, the percentage of incoming undergraduates among all degree-granting institutions who indicated they would major in CS declined by 70 percent between fall 2000 and 2005.2
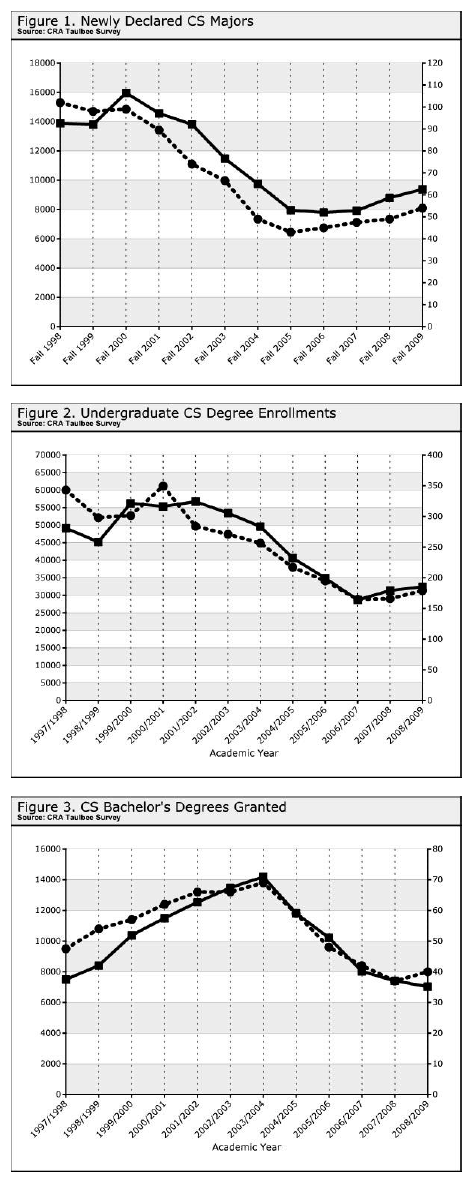
Unsurprisingly, the number of students who declared their major in CS among the Ph.D.-granting departments surveyed by CRA also fell. After five years of declines, the number of new CS majors in fall 2005 was half of what it was in fall 2000 (15,958 versus 7,952). From 2005 to 2007, the number of new majors was nearly flat. In 2008, the first increase in new majors since 2000 was reported; in 2009, the upward trend continued with 9,380 new majors reported.
The stabilization in the number of new majors over the past several years has in turn halted the decline in the total enrollment in CS. Enrollments declined steadily from their peak in 2001-02 through 2006-07, but 2007-08 saw an uptick and 2008-09 an additional increase. If the number of new majors continues to rise, enrollment will follow. New majors take roughly three to five years to complete their degrees. We can expect, therefore, that the stabilization followed by an increase in new majors will take about that long to be seen in degree production. Not surprisingly, the number of degrees granted fell again in 2008-09 to 7,030, a decline of about 5% from 2007-08. This does, however, represent a gradual improvement after an 8% decline last year, preceded by several years of double-digit declines.
It is important to note that fluctuations in degree production among CS departments have happened before. According to NSF, between 1980 and 1986, undergraduate CS production nearly quadrupled to more than 42,000 degrees. This period was followed by a swift decline and leveling off during the 1990s, with several years in which the number of degrees granted hovered around 25,000. During the late 1990s, CS degree production again surged to more than 57,000 in 2004.3 This more recent peak has also been followed by a decline and now a leveling off, and the current increase in new majors seems likely to be a leading indicator of future increases in degrees granted.
Notes:
1 See Appendix Table 2-1 at: http://www.nsf.gov/statistics/seind10/
2 HERI/UCLA’s “CIRP Freshman Survey” is an annual survey of the characteristics of students attending colleges and universities as first-time, full-time freshmen: www.gseis.ucla.edu/heri/cirpoverview.php.
3 See: http://archive.cra.org/info/education/us/bs.html