Where are the Minorities in Computing?
It is well recognized that increasing the diversity of the workforce is very important to the field of computing. In this article we focus on diversity within doctoral programs because it has a significant impact on diversity among both faculty members and researchers in industry and government labs. In particular, we focus on the source of minority students for graduate programs in computer science with respect to the following underrepresented groups: African Americans, Hispanics, and American Indian or Alaska Natives.
In the December 2011 issue of the CACM, the authors published an article on the need to consider different sources of data when investigating trends about the demographics of the computing field. We use this as a starting point for this article to address the issue of where the minorities are with respect to the bachelor’s degree because these students are the candidates for the graduate programs.
In an effort to identify trends in graduation rates for ethnic minorities, the Center for Minorities and People with Disabilities in IT (CMD-IT, http://www.cmd-it.org) accessed data from the following two databases:
- Computing Research Association (CRA) Taulbee reports ( http://www.cra.org/resources/taulbee/) for Computer Science only.
- WebCASPAR (https://webcaspar.nsf.gov/), using IPEDS/NCES (the Integrated Postsecondary Education Data System [IPEDS]), a survey conducted by the Department of Education’s National Center for Education Statistics (NCES) to obtain data for Race and Ethnicity. The WebCASPAR database provides easy access to a large body of statistical data resources for science and engineering at U.S. academic institutions. The focus, however, is on the field of Computer Science.
Bachelor’s degree graduation rates for the past 10 years from the two data sources are shown in Figure 1. It is noted that the number of institutions for the bachelor’s degree from the two data sources are vastly different. For example, for 2009 WebCASPAR included at least 1,283 institutions for the bachelor’s degree, 442 institutions for master’s degree, and 97 institutions for the doctorate degree. In particular, the institution counts correspond to those that reported awarding at least one degree at the given level. By contrast, for the 2009-10 academic year, the CRA Taulbee data are based on completed surveys from 150 CS Programs, almost all of which have PhD programs.
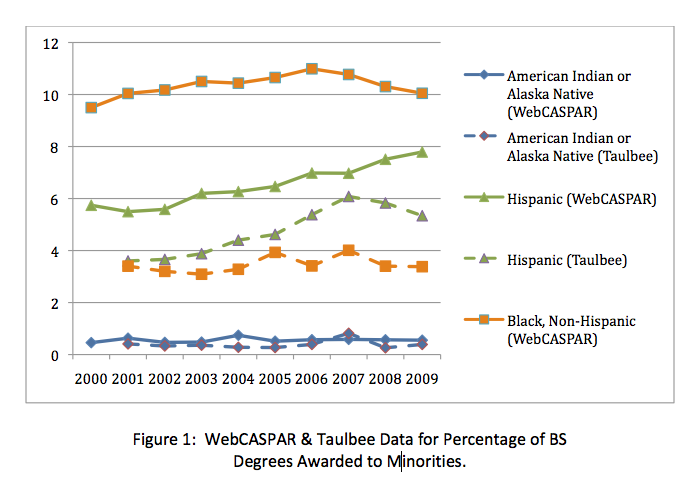
As indicated in the CACM article, there is a significant difference in the trends reported by the two data sources regarding minorities. For WebCASPAR, the percentage for Black is in the 10% to 11% range, in contrast to 3% to 4% indicated for Taulbee. In the case of Hispanics, there is some difference in the percentages, with WebCASPAR indicating percentages in the range of 5% to 8% and Taulbee indicating percentages in the range of 3% to 6%. In the case of American Indian/Alaska Native, the percentages are less than 1% for both data sources. Further, it is noted that the Taulbee data indicate a recent decline in the percentage of Hispanic bachelor’s degrees in contrast to the WebCASPAR data, which indicate a recent increase in the percentage of Hispanic bachelor’s degrees.
For the WebCASPAR data, we also extracted the data given in Figure 1 sorted by institution classification according to the standard Carnegie Classification [http://classifications.carnegiefoundation.org]. For completeness, we provide a short summary of the classifications below that are important for this article. The numbers in parentheses identify the current number of institutions in the given category.
- Institutions that awarded at least 20 research doctorates during the update year (excluding doctoral-level degrees that qualify recipients for entry into professional practice, such as the JD, MD, etc.).
- Research University-Very High Research Activity [108 institutions]: institutions that were very high on either aggregate or per-capita indices.
- Research University-High Research Activity [99 institutions]: institutions that were high on at least one index, but very high on neither.
- Doctoral/Research Universities [90 institutions]: remaining institutions and those not represented in the NSF data collection.
- Master’s Colleges and Universities [727 institutions] : institutions that awarded at least 50 master’s degrees during the update year, but fewer than 20 research doctorates (as defined above).
- Baccalaureate College [808 institutions] : institutions for which the bachelor’s degrees accounted for at least 10 percent of all undergraduate degrees and they awarded fewer than 50 master’s degrees in the update year.
- Special Focus Institutions-Other [850 institutions] : based on the concentration of degrees in a single field or set of related fields, at both the undergraduate and graduate levels; institutions were determined to have a special focus with concentration of at least 75% of undergraduate and graduate degrees.
- Tribal Colleges [32 institutions] : members of the American Indian Higher Education Consortium, as identified in the IPEDS (National Center for Education Statistics Integrated Postsecondary Education Data System) Institutional Characteristic data.
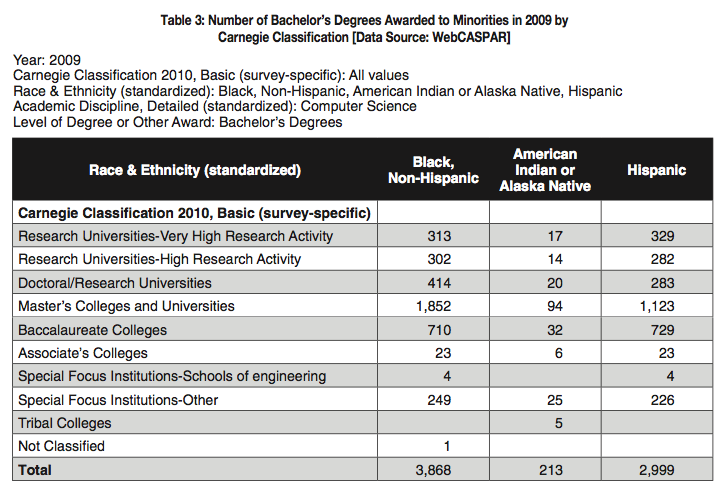
Tables 1 through 3 provide the number of bachelor’s degrees awarded to African Americans, American Indians or Alaska Natives, and Hispanics by Carnegie classification for the years 2005, 2007, and 2009. The data indicate that the classification with the largest number of bachelor’s degrees awarded to minorities is consistently Master’s Colleges and Universities, followed by Baccalaureate Colleges. In most cases, the numbers for the Baccalaureate Colleges are about one-half of those of the Master’s Colleges and Universities. Further, in comparison to the Research Universities, the Master’s Colleges and Universities award up to a factor of six more bachelor’s degrees to minorities.
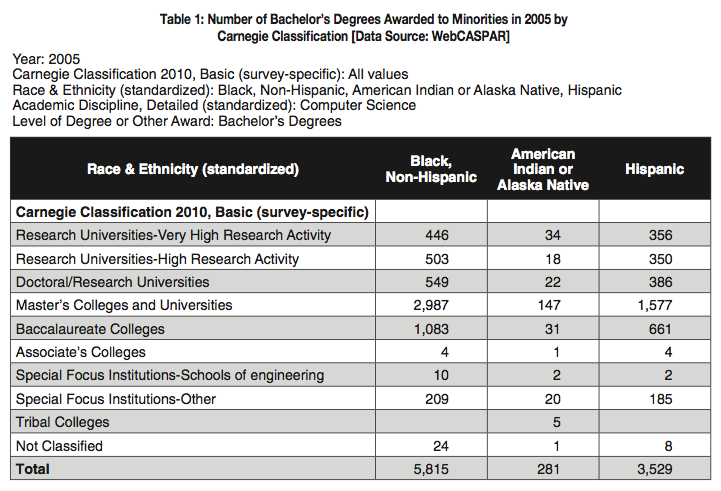
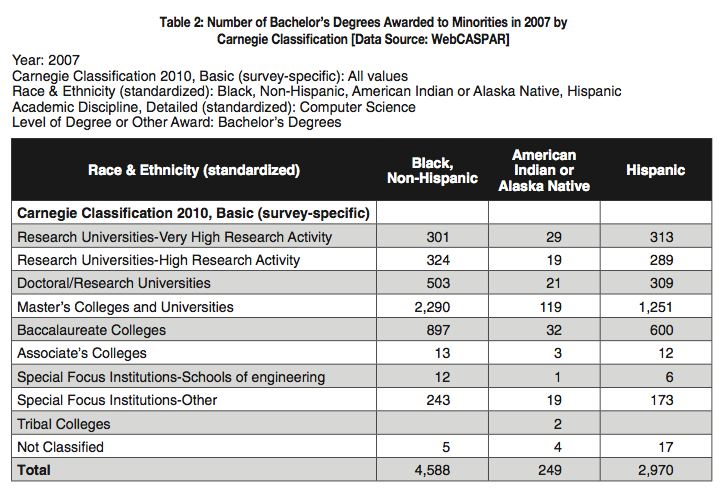
If we look further at the data, taking into consideration the number of institutions for each categorization, we find the following averages per institution type for 2009 with respect to total number of minorities: Research University-Very High Research Activity has an average of six minority students per institution; Research University-High Research Activity also has an average of six minority students per institution; Doctoral/Research University has an average of eight minority students per institution; Master’s Colleges and Universities has average of four minorities per institution; and Baccalaureate Colleges have an average of two minorities per institution.
When looking through the list of institutions, however, the distribution is not uniform. There are a few spikes, with many institutions graduating one or two minorities with a bachelor’s degree. The institutions with more than 25 minorities are Minority Serving Institutions (MSIs) and for-profit institutions (most in the categories of Master’s Colleges and Universities).
To increase diversity in our doctoral degree programs in computing the data indicate the need to recruit minority students from MSIs and for-profit institutions. In particular, the data raise the following questions for discussion by the computing research community:
- Assuming only a small percentage of bachelor’s degree students continue on to get the doctorate degree, can research institutions increase the diversity in their doctoral programs by recruiting only from other research institutions?
- What conditions are necessary for doctoral programs to establish strong pipelines with programs with master’s colleges and universities, in particular MSIs and for-profit institutions?
- How can organizations such as the CRA promote an interest in research among students who attend MSIs and for-profit institutions to encourage them to apply successfully to doctoral programs?
We look forward to continued discussion on the topic of increasing diversity in the computing research community.
Valerie Taylor is the Royce E. Wisenbaker Professor in Computer Science and Engineering at Texas A&M University and Executive Director of the Center for Minorities and People with Disabilities in IT
Richard E. Ladner is the Boeing Professor in Computer Science and Engineering at the University of Washington, Principal Investigator for the AccessComputing Alliance, and Deputy Director of the Center for Minorities and People with Disabilities in IT.