CIFellows 2020 For the Record
< Back to CIFellows 2020 for the Record Landing Page
2. The 2020 CIFellows
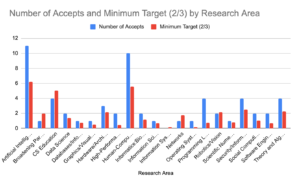
Proposed
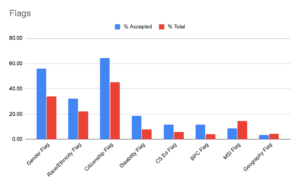
The Selection Committee selected 59 awardees (Proposed Fellows and their Institutions). The two graphs below give an overview of the proposed fellows’ demographics. In each case, the red bars are minimum targets set beforehand and the blue bars are what we achieved. These need to be interpreted carefully. For the top graph, the red target indicates two-thirds of what a strictly proportional allocation to areas would produce. For the bottom graph, the red target was the percentage of the pool that met that characteristic.
There were 61 different institutions, with Fellows coming from 45 different institutions and going to 40 different Institutions. The MAX-2 constraint played a big role in the selection process.
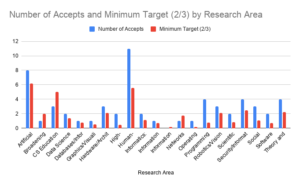
Finalized
Three of the awarded Fellows chose to decline the Fellowship. Two took other offers and one had geographic constraints. Additional applicants were offered the Fellowship, resulting in 59 Fellows. 59 different institutions were impacted in the community (fellows coming from 46 different institutions and going to 41 institutions). Overview graphs of the class of Fellows:
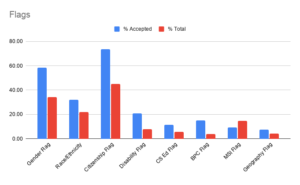
Full demographic statistics on the Fellows can be found in Appendix V. A listing of all Fellows can be found in Appendix W.
More Information
- For more information please check out the CIFellows 2020 Website
- Please submit ideas and feedback to cccinfo@cra.org
- Interested in learning more and being involved?Subscribe for announcements here