D. The Mixed News on Diversity and the Enrollment Surge
A positive consequence of the current enrollment surge is a significant increase in the number of women and underrepresented minority (URM) students in computer science, both in courses and as majors. In addition, there is also some good news in regard to the percentage of women and URM students in aggregate; the good news, however, is not universal across all units[1] surveyed.
This section examines the impact of the enrollment surge on diversity, using both existing data sets (i.e., the CRA Taulbee Survey and IPEDS) and data collected from the CRA Enrollment Survey. We also highlight relationships discovered between actions to manage the surge and their impact on diversity.
The survey asked units for women and URM student enrollment data, and the data is examined later in this section. The survey also asked each unit’s perception about trends in the recruitment and retention of students from underrepresented groups. Approximately 50% of the units perceive the percentage of women in their unit is increasing. While this perception exists in both doctoral- and non-doctoral granting units, doctoral-granting units were more likely to state the percentage of females in their unit is increasing significantly. We understand that perception may not reflect reality but, in this case, hard data on the percentage of women enrolled in the introductory course for majors is consistent with the unit’s self-reported change in the ratio of women entering the major. Specifically, the proportion of women in the intro majors course at doctoral-granting units increased by an average of 0.4 percentage points from 2010 to 2015 for units that self-reported the proportion of women was level or declining (n=18), by 5.1 percentage points for units reporting the proportion of women as increasing (n=14), and by 7.3 percentage points for units reporting the proportion of women as significantly increasing (n=8). Furthermore, the enrollment data results discussed in this section show that the median percentage of female students in the courses surveyed has increased overall at both doctoral- and non-doctoral granting units. While some may consider the percentage increase to be significant, others would likely note that we are still a long way from gender parity.
Approximately 50% of doctoral- and 30% of non-doctoral granting units perceive the percentage of URMs in their unit is level, while approximately 20% of doctoral- and 40% of non-doctoral granting units perceive the percentage of URMs in their unit is increasing. The results presented in the rest of this section show that the median percentage of URM students in our four representative courses not at minority-serving institutions is increasing. However, the percentage increase for URM students is larger in the intro course for non-majors than the intro course for majors at doctoral-granting units.
While there is some good news here, the data does suggest a shrinking pipeline may exist for both female and URM students (i.e., in the course data provided, the representation of these students decreased from the intro through mid-level through upper-level courses). Also, as mentioned previously, not all units are seeing an increase in the percentage of women and URM students participating in computer science. In short, much work remains to meet our community’s goals for diversity.
Diversity Statistics From the Taulbee and IPEDS Data
To provide context for the CRA Enrollment Survey data, we will first look at diversity statistics from the CRA Taulbee Survey and IPEDS data for the period of 2006-2015. Taulbee graduation rates for doctoral-granting units show that female students comprised 14% of the computer science bachelor’s degrees in 2006. This percentage declined over subsequent years until it reached a low point of just above 11% in 2009. Since 2009, we have seen a slow but steady increase, with female students earning 16% of the 2015 computer science bachelor’s degrees awarded. The IPEDS statistics for women [G. IPEDS Data], which provides completion data for both doctoral-granting and non-doctoral granting units, shows a similar trend. According to IPEDS data for doctoral-granting units, women comprised 13.6% of 2006 computer science bachelor’s degree graduates, 11.3% of 2008 graduates (the low point), and 15.3% of 2015 graduates. For non-doctoral granting units, the percentage of women has been higher overall, with 20.5% of computer science bachelor’s degrees being awarded to women in 2006, declining to 15.5% by 2011 (the low point), and rising slightly to 16.6% in 2015.
For URMs, we consider Blacks/African Americans, Hispanics/Latinos, and other underrepresented groups (American Indians or Alaska Natives plus, after 2007, Native Hawaiians or Other Pacific Islanders). The omission of the Asian and Multiracial (“Two or more Races”) categories is designed to avoid considering groups that are not underrepresented in computing. We first examine the Taulbee Survey data for doctoral-granting units. In 2006, URM students comprised 9% of the CS graduating students at doctoral-granting units. We saw the percentage of URM students earning bachelor’s degrees in CS increase to 12% in 2008, which coincided with the shift to new categories for race and ethnicity, a decrease to 9% in 2010 (the low point), and a subsequent gradual increase to 11% in 2015. IPEDS statistics for doctoral-granting units are a bit different from the Taulbee data, likely because of the difference in the definition of doctoral-granting[2], but the general trend shows 11-12% of computer science bachelor’s degrees were awarded to URMs from 2006-2011; in 2015, URM students comprised 13% of the computer science bachelor’s degree graduates at doctoral-granting units. In non-doctoral granting units, IPEDS data shows a higher percentage of URM students, with almost 20% in 2006, but remaining close to 18% for most of the 2007-2105 period. A decline in Black/African American completions was offset by an increase in Hispanic/Latino completions.
The Impact of the Enrollment Surge on the Representation of Women
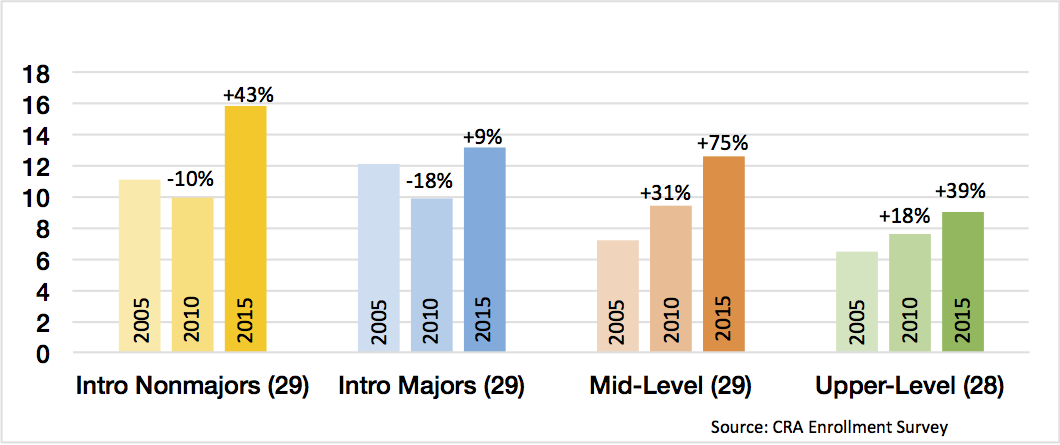
The CRA Enrollment Survey shows that the percentage of women has grown in all three of the CS major courses surveyed from 2005 to 2015 for both doctoral-granting and non-doctoral granting units (Figure D.1). For doctoral-granting units, most of this growth occurred between 2010 and 2015; for non-doctoral granting units, this growth occurred between 2010 and 2015 in only the mid- and upper-level courses. Doctoral-granting units also showed consistent growth from 2005 to 2015 for their nonmajor intro course. Unfortunately, there is not sufficient data on the nonmajor intro course for non-doctoral granting units. That is, only 20-22 non-doctoral granting units of the ~700 provided course diversity data in the CRA Enrollment Survey for each of the 2005, 2010, and 2015 periods surveyed, and only 11 of these units provided diversity data for a separate nonmajor intro course.
For the non-doctoral granting units that provided course enrollment data, the median percentage of women was slightly higher than in doctoral-granting units. We also note that the median percentage of women at doctoral-granting units in the upper-level course in 2015 (17%) (Figure D.1(a)) is close to the Taulbee percentage of women who graduated in 2015 (16%). For non-doctoral granting units, our course enrollment data at the mid- and upper-level shows a larger increase in the percentage of women from 2010 to 2015 than IPEDS data [G. IPEDS Data], which could be due to either our small sample size or a recent pipeline increase that has yet to be realized as CS degrees.
From Figure D.1, the largest percentage of women in doctoral-granting units can be found in the nonmajor intro course followed by the major intro course. Since percentages drop in the mid-level and upper-level courses, there may be an issue of retaining women into higher-level courses. While a similar trend exists in the non-doctoral granting units, we stress that this question regarding retention requires further study. For example, one possible explanation could be that the apparent decrease is simply a byproduct of growth. That is, students in upper-level classes entered the program at a time when the percentage of women was lower. Furthermore, the data seems to validate this explanation. That is, the percentage of women in the upper-level course in 2015 is between the percentage of women in the 2010 and 2015 mid-level courses. Another hypothesis is that the larger percentages in the lower-level courses reflect an increase in female nonmajors in those courses. Of course, if the trend reflects a leaky pipeline, where women are dropping out at a higher rate than men as they advance, a concern about female student retention is valid.
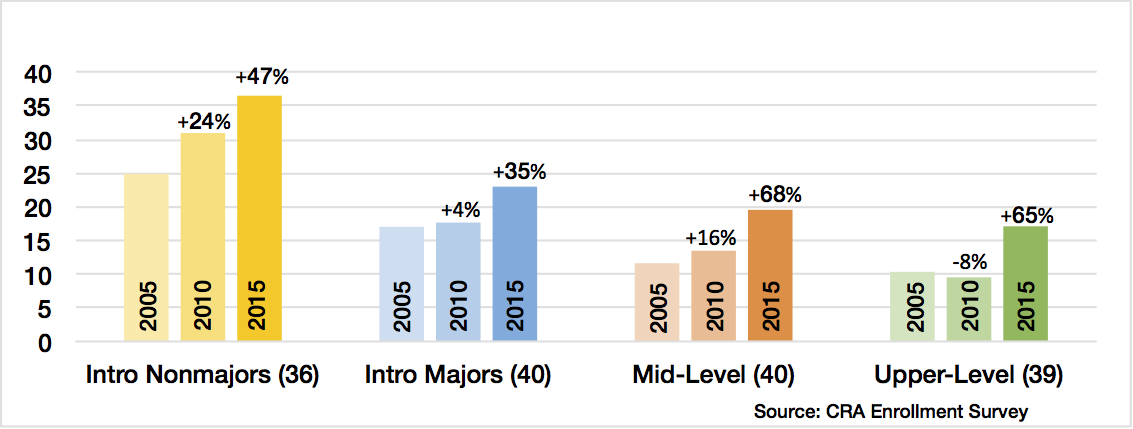
(a) Doctoral-Granting Units
(b) Non-Doctoral Granting Units
Figure D.1: Median percentage of female students in the courses surveyed.
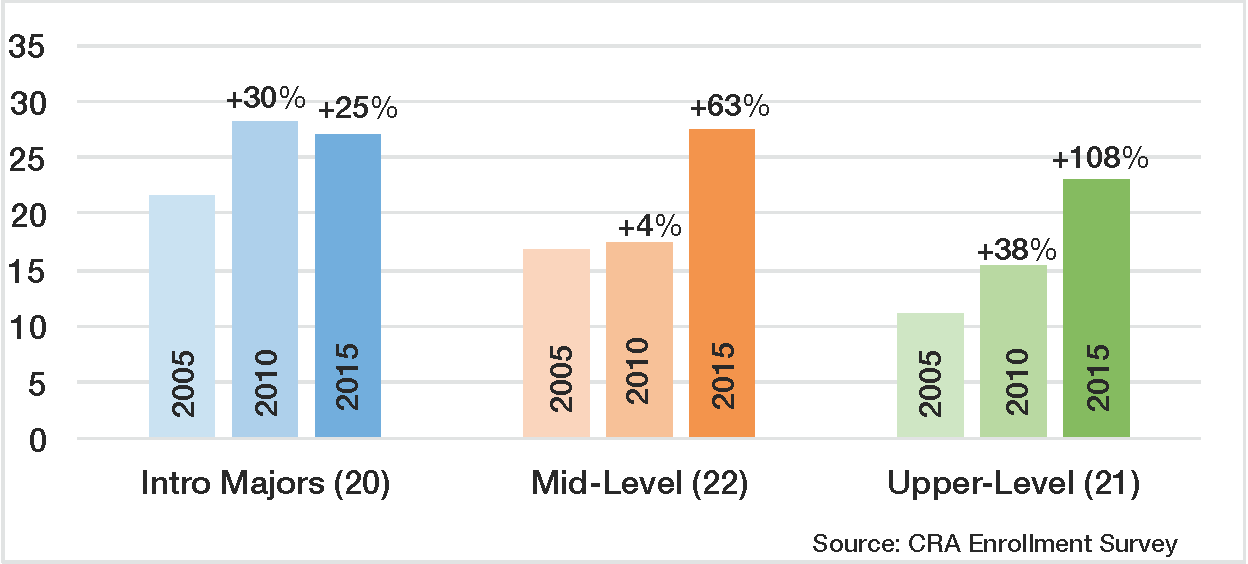
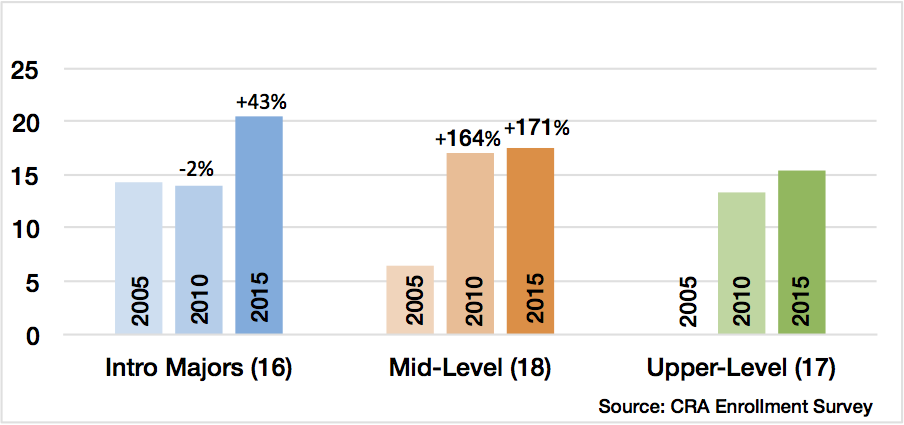
For doctoral-granting units, data also revealed more rapid growth in the percentage of women in private schools, as compared to public schools, in all four courses surveyed, as shown in Figure D.2. For example, consider the nonmajor intro course and the mid-level course. In both cases, public and private schools had similar percentages of women in 2005 and very different percentages of women in 2015. The 2015 IPEDS data corroborates this observation [G. IPEDS Data] (e.g., the percentage of female degree earners was 14% for public schools and 20% for private schools in 2015). A study of what private schools have been doing, or not doing, compared to public schools could be useful to increasing the number of women in CS.
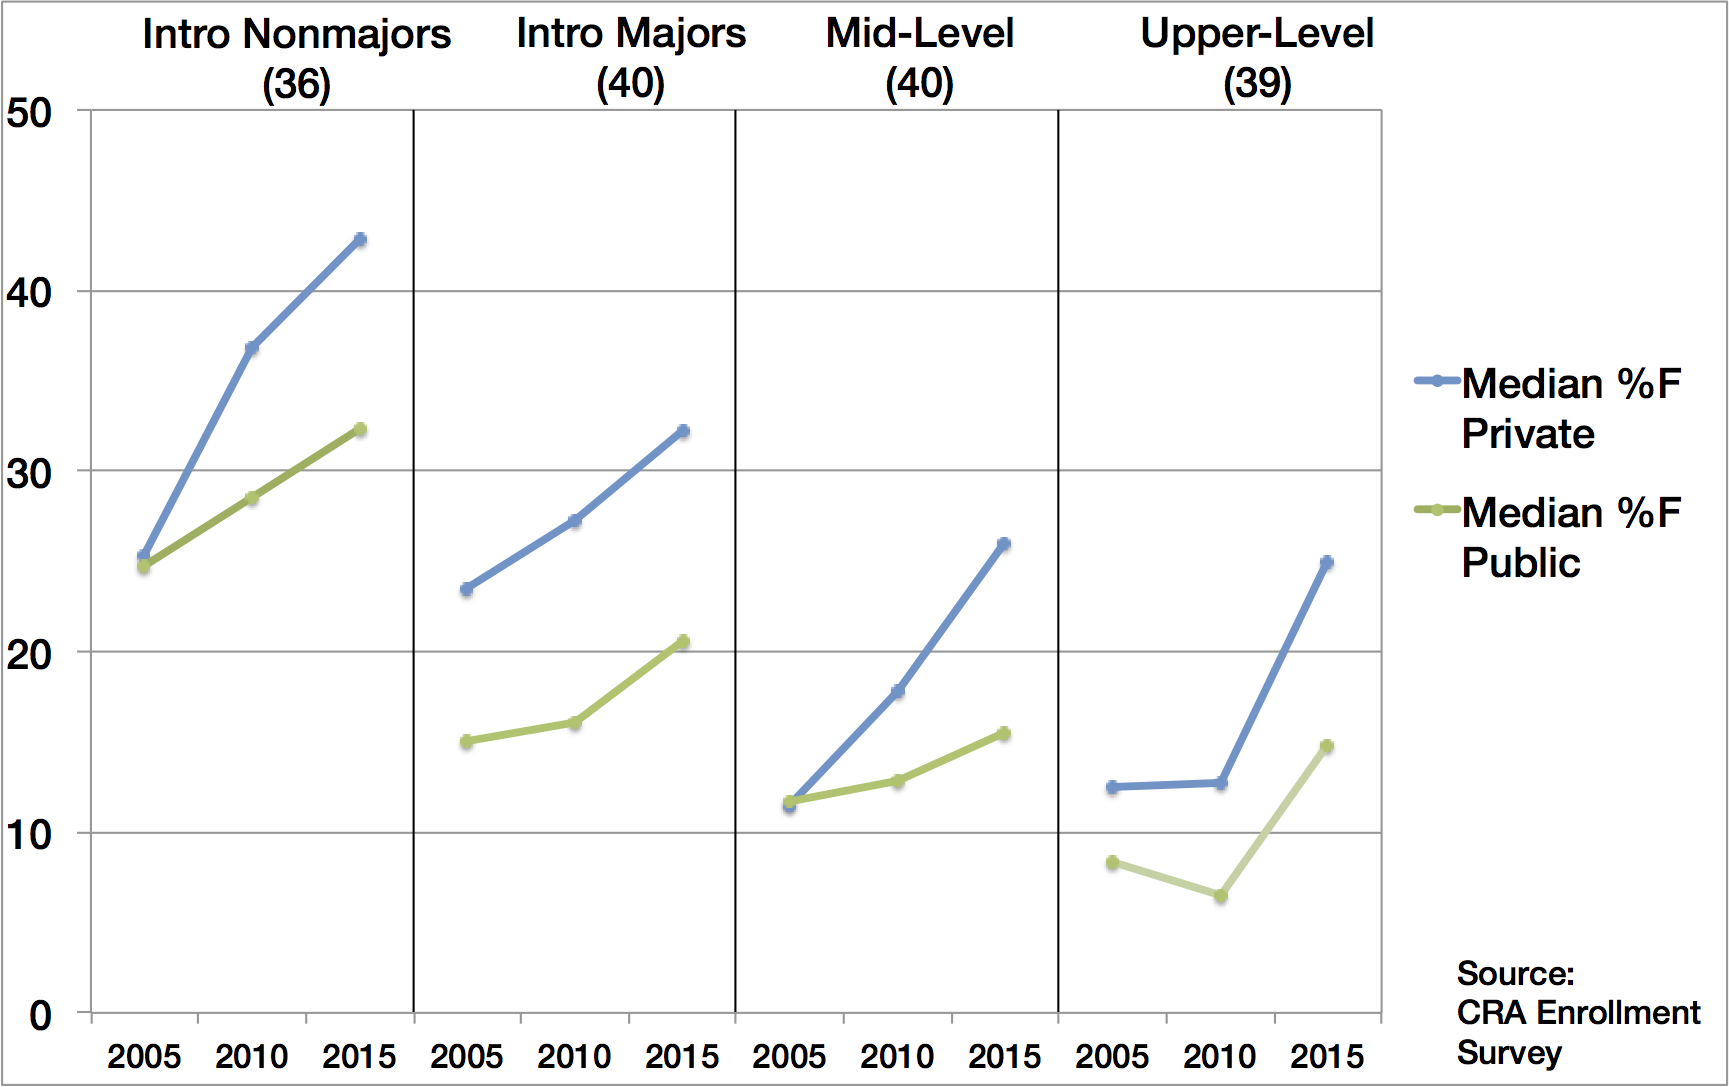
Figure D.2: Median percentage of female students in the courses surveyed in doctoral-granting units: public vs. private. Number in parentheses in each category indicates sample size.
While Figures D.1 and D.2 show the change in the median percentage of women across units, Figure D.3 shows how much women’s representation in the chosen upper-level course varies by unit. Across units, the percentage of women enrolled in the upper-level course ranged from a low of 0-2% (5 units in 2010, but none in 2015) to a high of 42-44% (one unit in 2015). In short, there is substantial variation across departments, but the distribution, as a whole, shifted up between 2010 and 2015.
Figure D.3: Number of doctoral-granting units with indicated percentage of women in representative upper-level courses in 2010 and 2015.
The Impact of the Enrollment Surge on the Representation of Underrepresented Minorities
The number of URM students has also shown remarkable growth since 2005, mostly between 2010 and 2015. As shown in Figure D.4, the total number of minority students reported in the course enrollment data of doctoral-granting units has grown from 708 to 808 to 1620 in the intro required course (33 units), from 299 to 443 to 992 in the mid-level course (33 units), and from 208 to 322 to 606 in the upper-level course (32 units). While this growth in the number of URM students is occurring at all units, we note that a significant number of URM students are added by the four minority-serving institutions (MSIs) in our sample. Because these MSIs have a very different profile of students, they could bias our data and are thus removed from the following analysis of percentages and correlations.
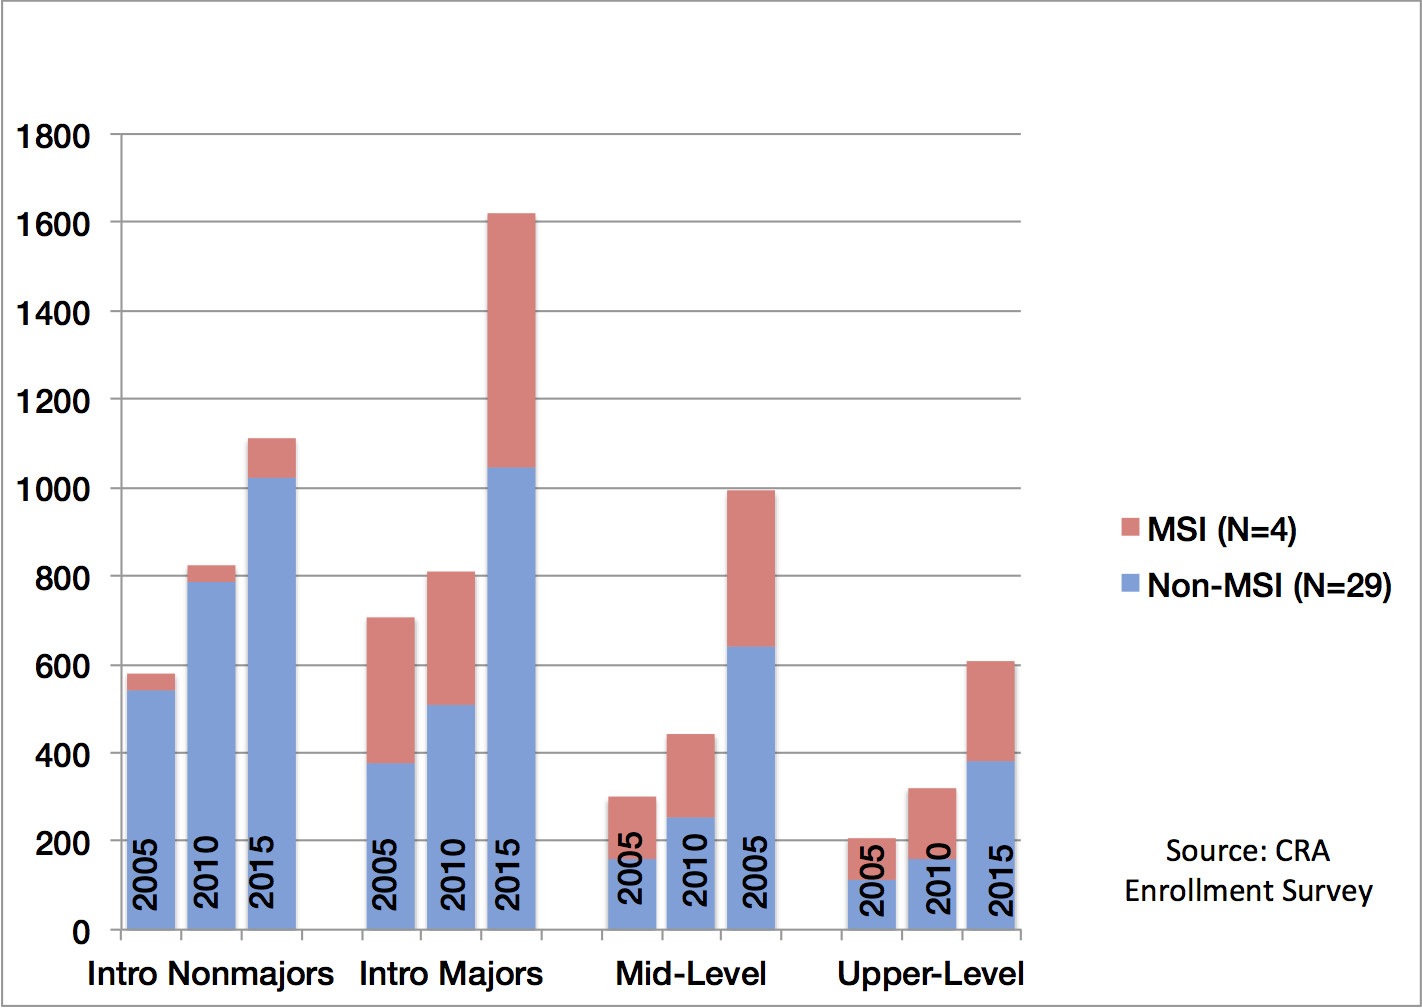
Figure D.4: Number of URM students in four representative courses in doctoral-granting units.
Figure D.5 shows the median percentage of URM students for each course, for both doctoral-granting and non-doctoral granting units (not including MSIs). While the percentage of URM students does not show the consistently increasing trend seen in the percentage of women students (see Figure D.1), we note the percentage of URM students has increased when comparing 2005 to 2015 data for both doctoral- and non-doctoral granting units, which is consistent with the Taulbee and IPEDS data on degrees awarded. While our enrollment data does not consider different URM populations, the IPEDS data appears to show a decline in Black/African American students which is offset by a rise in Hispanic/Latino students.
Although the percentage of URM students appears to be growing, we note that the percentages are still extremely small (e.g., only 9% URM students in the 2015 upper-level course data for doctoral-granting units). In fact, in 2005, the median percentage of URM students reported by non-doctoral granting units for the upper-level course was 0. Clearly, there is much room for growth among the URM student population, especially when one considers that 34% of college students are URM in the United States[3]. Similar to the trends we see in the course enrollment data for women, we typically see a decrease in the URM student representation from the intro through mid-level through upper-level courses. As previously mentioned, further study is needed to determine whether a leaky pipeline exists.
(a) Doctoral-Granting Units
(b) Non-Doctoral Granting Units
Figure D.5: Median percentage of URM students in the courses surveyed (excluding MSIs).
No percentage increase is shown for non-doctoral upper-level courses because the 2005 median was zero.
The Relationships Between Unit Actions and Diversity Growth
The CRA Enrollment Survey included several questions about the actions that units were taking in response to the surge. In this section, we highlight a few statistically significant correlations that relate growth in female and URM students to unit responses (actually, a composite[4] of several different responses).
- Units that explicitly chose actions to assist with diversity goals have a higher percentage of female and URM students. We observed significant positive correlations between units that chose actions to assist with diversity goals and the percentage of female majors in the unit for doctoral-granting units (per Taulbee 2015, r=.19, n=113, p<.05), and with the percent of women in the intro majors course at non-doctoral granting units (r=.43, n=22, p<.05). A similar correlation was found for URM students. Non-MSI doctoral-granting units showed a statistically significant correlation between units that chose actions to assist with diversity goals and the increase in the percentage of URM students from 2010 to 2015 in the intro for majors course (r=.47, n=36, p<.001) and mid-level course (r=.37, n=38, p<.05). Of course, units choosing actions to assist with diversity goals are probably making many other decisions with diversity goals in mind. Improved diversity does not come from a single action but from a series of them.
- Units with an increase in minors have an increase in the percentage of female students in mid- and upper-level courses. We observed a positive correlation between female percentages in the mid- and upper-level course data and doctoral-granting units that have seen an increase in minors (mid-level course r=.35, n=51, p<.01; upper-level course r=.30, n=52, p<.05). We saw no statistically significant correlation with the increased number of minors in the URM student enrollment data. The CRA Enrollment Survey did not collect diversity information about minors. Thus, it is not possible to look more deeply into this finding from the collected data. Perhaps more women are minoring in computer science, which would then positively impact the percentage of women in mid- and upper-level courses. However, units that reported an increase in minors also have a higher percentage of women majors per Taulbee enrollment data (r=.31. n=95, p<.01). Thus, we can’t be sure of the relative contribution of women minors and majors to an increased percentage of women overall in the mid- and upper-level courses. In short, more research is needed to understand this finding.
- Very few units specifically chose or rejected actions due to diversity. While many units (46.5%) stated they consider diversity impacts when choosing actions, very few (14.9%) chose actions to reduce impact on diversity and even fewer (11.4%) decided against possible actions out of concern for diversity. In addition, only one-third of units believe their existing diversity initiatives will compensate for any concerns with increasing enrollments, and only one-fifth of units are monitoring for diversity effects at transition points.
Summary
Because of computer science’s past history, there is concern that the actions departments take to manage increased enrollments might have a side effect of reducing diversity. At this point, we see substantial increases in the number of women and underrepresented minorities enrolling in computer science courses, and median percentages of both groups at all course levels has also grown. This result holds for all courses for which there is sufficient data from our survey, and in both doctoral-granting and non-doctoral granting units. In other words, growth in female and URM students appears to be greater than the overall growth in students. Yet, we must continue our efforts to attract and retain these populations, as the percentages are still nowhere near where they should be. Our course data for both female and URM students shows decreases in each year as the course level increases. Further study is needed to determine whether a leaky pipeline exists, or whether there is another explanation for this trend.
This period of unprecedented growth in the field may actually be an opportunity to increase the diversity of computer science undergraduates. The CRA data shows that very few units are specifically choosing or rejecting actions due to diversity, but those that do have a higher percentage of female and URM students. It is likely that many of these units have been considering diversity in their actions over the long term, not just with respect to the enrollment surge. We strongly encourage units to track the diversity of their majors, minors, and nonmajors and to consider the effect of the actions that they take on the diversity of their programs. We need to ensure that the diversity gains we have recently seen can bring the computing community closer to representing the population that uses the technology we create.
[1] We use the term “academic unit” or “unit” to denote the administrative division responsible for the CS bachelor’s program. Often, but not always, this is an academic department.
[2] Taulbee and NDC survey data define doctoral- and non-doctoral granting units by whether the unit grants doctorates specifically in computing. IPEDS doctoral-granting units are institutions who grant at least 20 research/scholarship doctorates in any field (not including professional practice doctoral-level degrees such as JD and MD), following the Carnegie Classification of Institutions of Higher Education.
[3] National Science Foundation, National Center for Science and Engineering Statistics, TABLE 2-1: Undergraduate enrollment at all institutions, by citizenship, ethnicity, race, sex, and enrollment status: 2004–14. Retrieved from: https://www.nsf.gov/statistics/2017/nsf17310/data.cfm [Feb. 23, 2017].
[4] Composites that were used for correlations include “Any Diversity Action Taken” and “Diversity Considered in Decisions”. Specifics of how these composites were determined are given in [H: Methodology].