REU Participation Encourages Students to Pursue Graduate Degrees
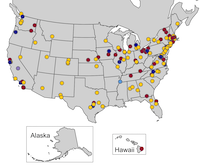
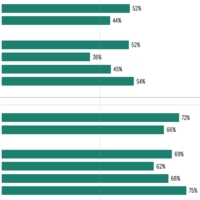
Using CRA Data Buddies Survey data, this analysis presents changes in undergraduate students’ highest degree intentions over the course of a year. Students who participated in an REU during that year showed an interest in pursuing a higher-level academic degree than those who did not participate in an REU.