Tiretracks to Innovation in Information Technology
“If we knew what we were doing it wouldn’t be research.” – Albert Einstein
“Research is what I’m doing when I don’t know what I’m doing.” – Wernher von Braun
I’ve always gotten a good chuckle out of these famous quotes. They are funny because I think they contain an element of truth.[1] Research, in its purest form, is an endeavor that is largely unplanned and curiosity-driven, sometimes involving years or even decades of trial-and-error (and, at times, self-deprecating humor).
My own joke about research is that it is like an accident slowly waiting to happen. What I mean is the following. When we do research, we sometimes get answers with expected applications at expected times; however, just as often the results of research have unexpectedly impactful outcomes at unexpected times. For example, who would have ever predicted that research in areas as diverse as networking, distributed systems, and artificial intelligence in the 1970’s might someday enable today’s search engines? Such serendipity in research is important because the very idea of a surprising outcome relates to expanding what people imagine is possible. For this reason, my view is that the connection to serendipitous outcomes is a hallmark of great research breakthroughs. And while the path from research breakthrough to practical technology can take time – sometimes years or even decades – when it finally happens it has the power to change the world for the better, for example by addressing societal grand challenges or create huge economic payoffs.
Of course, serendipity is hardly the whole story of the impact of computing research. Over the past 50 years there simply has been no greater engine for technological advancement and economic growth than information technology. There is a rich interplay of people, ideas, and organizations that spans universities, industry, and the Federal government. This interplay involves basic research in computing and creates a torrent of technological, business, and social innovations. Through visionary investment – most importantly by Federal government – we have fostered an ecosystem that supports the free flow of ideas and people, leading to countless new products and whole new industry sectors, which in turn have completed the virtuous cycle by inspiring new problems and directions for basic research. The overall result has been a fundamental transformation of virtually every human endeavor – in science, commerce, education, healthcare, manufacturing, governance, and even arts and entertainment.
This synergy between universities, industry, and the government is part of an innovation ecosystem that has led to amazing economic growth, according to numerous studies, most notably by the National Research Council’s Computer Science and Telecommunication Board (CSTB). A CSTB report published in 1995[2] was particularly notable for its use of a diagram to depict the complex interactions of this ecosystem, including the central role of Federal support, the unpredictable (and sometimes decades-long) time from research result to major economic payoff, and the potential for serendipitous outcomes. This diagram, which has since been referred to as the “tiretracks,” has proven to be remarkably effective at explaining the innovation ecosystem to a wider audience including, importantly, policymakers. As a result, the tiretracks diagram has become an important tool for promoting the cause of the computing research community. Two updates to the diagram have been produced by the CSTB, the first in 2003[3] and the second in 2012 in the new report entitled, Continuing Innovation in Information Technology.[4] This most recent version of the diagram (which unlike the previous versions is designed to be Powerpoint-friendly) is reproduced below.
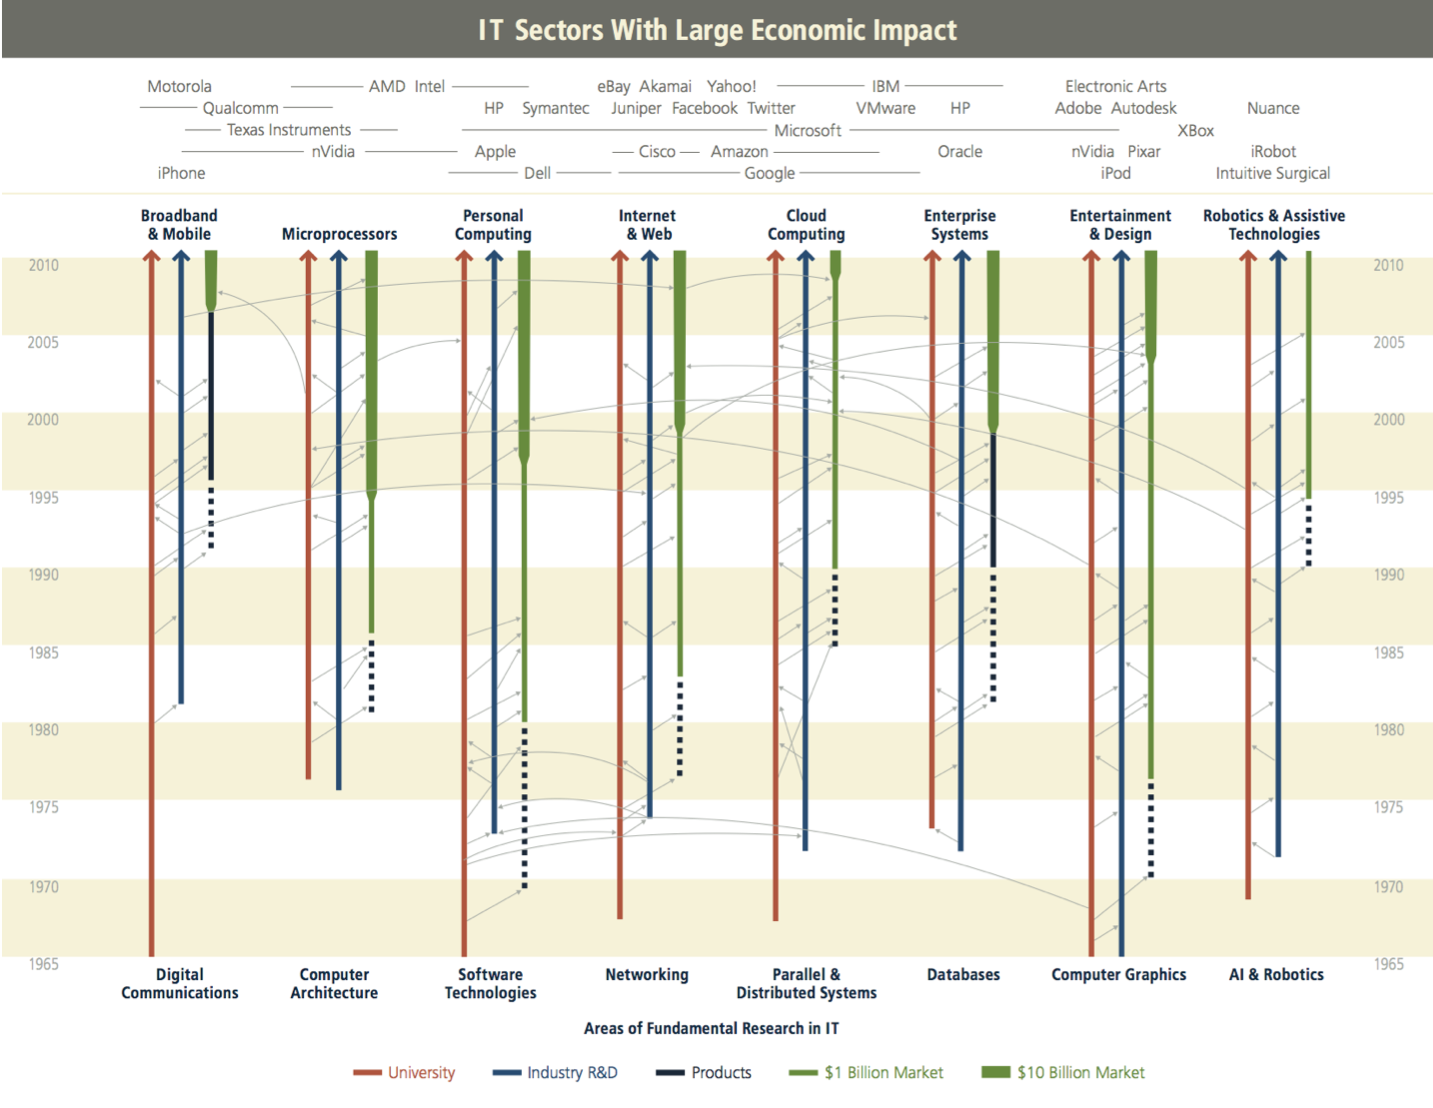
The 2012 Tiretracks Diagram.
The full report, diagram, poster, and tri-fold brochure can all be found at http://sites.nationalacademies.org/CSTB/CurrentProjects/CSTB_045476.
The 2012 report shows that the economic impact of the IT innovation ecosystem continues to grow unabated. At the macroeconomic level, the report cites several studies, such as the one by the Bureau of Economic Analysis showing that “information-communications-technology-producing” grew by an estimated 16.3% in 2010 and contributed nearly 5% to the overall US GDP.[5] And as amazing as this is, since the study focuses exclusively on the economic impact on the US IT industry and ignores the substantial impact throughout all sectors of the economy, it vastly underestimates the true economic impact of IT. In addition to macroeconomic analyses, the CSTB report identifies sectors in today’s IT industry that each sustain annual revenues in excess of $10B. These include stalwart sectors such as microprocessors, broadband technologies, and personal computing. But importantly, they also include rapidly emerging sectors such as cloud computing, robotics, and entertainment technologies. The report traces each of these back to core enabling technologies that in turn can be traced back to the oftentimes complex interactions between federally supported research at universities, R&D at industrial labs, and new product developments.
Explaining the Tiretracks
The tiretracks diagram starts with an array of well-known IT companies and products along the top. These are chosen to be well-known to the general public so that they can make an easy connection with the primary audience for the diagram, namely policymakers and others not necessarily well-versed in the IT field. In essence, these companies and products are the main “punchlines” of the tiretracks diagram. Below these companies and products is a list of major sectors of the IT industry, each of which sustains annual revenues of at least $10B. Together, these companies, products, and sectors represent the tremendous economic impact of IT innovation.
Leading up to these industry sectors are the actual tiretracks. The red lines represent Federally supported academic research and the blue lines represent industrial research and development. At the bottom of each track is a label indicating the broad area of basic research in computing represented by that track. The dotted black lines show the emergence of viable products. These dotted lines turn green when markets sustaining at least $1B in annual revenues emerge, and then get fat when they grow into $10B markets.
Shown in light gray, arrows connect the various lines of the tiretracks. These arrows depict the flow of ideas, technologies, research results, and people between academia and industry, as well as the serendipitous connections between the tracks. An appendix in the CSTB report gives written explanations of several of these arrows.
Now, the tiretracks diagram is a pretty busy picture, and to some extent that is one of the main points. There is a lot of complexity in the rich set of interactions leading to economic impact and so the graphic design of the diagram is meant to show that.
Having said that, the diagram is much simpler than it might otherwise be; some might complain that it is too simple. The tiretracks, while historically accurate, is not a documentation of history and makes no attempt to be complete. Instead, it only highlights a tiny sample of outcomes and interactions in research and commercial development in IT in order to focus attention on the main points about the IT innovation ecosystem. So, for example, major areas of high-impact computing research don’t appear in the diagram at all, such as computer science theory and human-computer interaction, to name just two, each for a different reason. Another notable feature in the diagram is the rather simple-minded one-to-one connection between each broad research area (listed on the bottom of each track) to a single IT industry sector (listed on the top of each track). This of course vastly over-simplifies what really happens.
While it may be possible to develop a new diagram that captures more completely the many impactful research areas, the huge number of key research results and interactions, and the full complexity of cross-influences of fields and market sectors, it is important to keep in mind that the purpose of the diagram isto support the telling of “stories” that help explain the elements of the IT innovation ecosystem to an audience of policymakers. As one member of Congress put it when asked for advice about the tiretracks revision, “Just tell me how Federal support for computing research ended up contributing to the creation of things like Facebook. I don’t need to know about the complete history of the research.”
Our experience since 1995 indicates that the tiretracks concept strikes just the right level abstraction for explaining the impact of IT innovation.
Using the Tiretracks to Tell Our Story
The tiretracks diagram is designed to support each of us in the computing research community in telling our stories about how basic research contributes to new possibilities and economic growth. An example of just one such story – on the research underpinnings of electronic commerce – can be found in the 2012 CSTB report (Box 4, pg.13). Many more such stories need to be written and told.
In order to facilitate the development of these stories, the Computing Community Consortium, in collaboration with Microsoft Research, will produce a series of short articles, to appear in the next six issues. Each article will give one story as an illustration of the concepts depicted in the tiretracks diagram.
The hope is that these stories will be useful to you as you advocate for the field of computing research. Perhaps they will stimulate you to write your own stories.
Who knows what kind of serendipitous outcomes might arise from this…
Acknowledgments
The 2012 tiretracks report, Continuing Innovation in Information Technology, was the result of a study by the National Research Council’s Computer Science and Telecommunications Board. A full list of acknowledgments appears in that report. Peter Lee is the Corporate Vice President for Microsoft Research USA.
[1] In fact, it is possible that neither statement was meant as a joke.
[2] Evolving the High Performance Computing and Communications Initiative to Support the Nation’s Information Infrastructure. The National Academies Press, 1995.
[3] Innovation in Information Technology. The National Academies Press, 2003.
[4] Continuing Innovation in Information Technology. The National Academies Press, 2012. Free download available at http://www.nap.edu/catalog.php?record_id=13427.
[5] 2010 Recovery Widespread Across Industries. Bureau of Economic Analysis, 2011. Available at http://www.bea. gov/newsreleases/industry/gdpindustry/2011/pdf/gdpind10_adv_fax.pdf.