G. Appendix: IPEDS Data
Comprehensive data from the Integrated Postsecondary Education Data System (IPEDS) on degree completions at CS and CIS programs can improve our understanding of the CRA Enrollment Survey data, especially in relation to non-doctoral granting institutions. The data provided in this section is from the IPEDS Data Center on degree completions for two Classification of Instructional Programs (CIP) codes: Computer and Information Sciences, General (11.0101) and Computer Science (11.0701). The data is for all Carnegie-classified, not-for-profit, 4-year public and private institutions in the United States, Guam, Puerto Rico, and the U.S. Virgin Islands. We looked at completions under both 11.0101 and 11.0701 since some institutions with computer science degree programs report completions under CIP code 11.0101, while others report completions under 11.0701. In this section, we use “CS” to represent reported completions under both 11.0101 (CIS, general) and 11.0701 (CS).
Comparing IPEDS Data to the CRA Enrollment Survey Data
The CRA Enrollment Survey collected data from 134 doctoral-granting units[1] and 93 non-doctoral granting units. To compare the CRA Enrollment Survey data collected with IPEDS degree completions, we consider two groupings of Carnegie-classified institutions: (1) Highest, Higher and Moderate Research Doctoral Institutions (Doctoral in Figure G.1) and (2) Large, Medium and Small Masters and Liberal Arts and Diverse Baccalaureate Institutions (Non-Doctoral in Figure G.1).
Figure G.1 shows remarkable growth in CS completions (94%) at the 313 Carnegie-classified doctoral-granting units[2] from 2009 (which reflects growth in majors that began three years earlier) to 2015. The IPEDS degree completion data is consistent with the substantial growth reported in [B. Growth of CS Majors]. Figure G.1 also shows noteworthy growth in IPEDS CS completions (48%) at the 1,185 Carnegie-classified non-doctoral granting units. Since the increase in the number of degree completions at non-doctoral granting units is less than the increase in the number of degree completions at doctoral-granting units, it is not surprising that non-doctoral granting units are less likely than doctoral-granting units to report they are experiencing a significant impact from increasing enrollments [E. Impact on Unit].
The CRA Enrollment Survey collected data from 134 doctoral-granting units, which is a substantial portion of the 313 Carnegie-classified doctoral-granting units in IPEDS. However, the CRA Enrollment Survey collected data from only 93 non-doctoral granting units, which is a small fraction of the 1,185 non-doctoral granting units in the IPEDS data. The IPEDS data represents a much wider variety of institutions than the CRA Enrollment Survey data. The IPEDS institutions include small, medium, and large masters programs; liberal arts bachelor degree programs; more specialized bachelor degree programs; and other kinds of non-doctoral institutions.
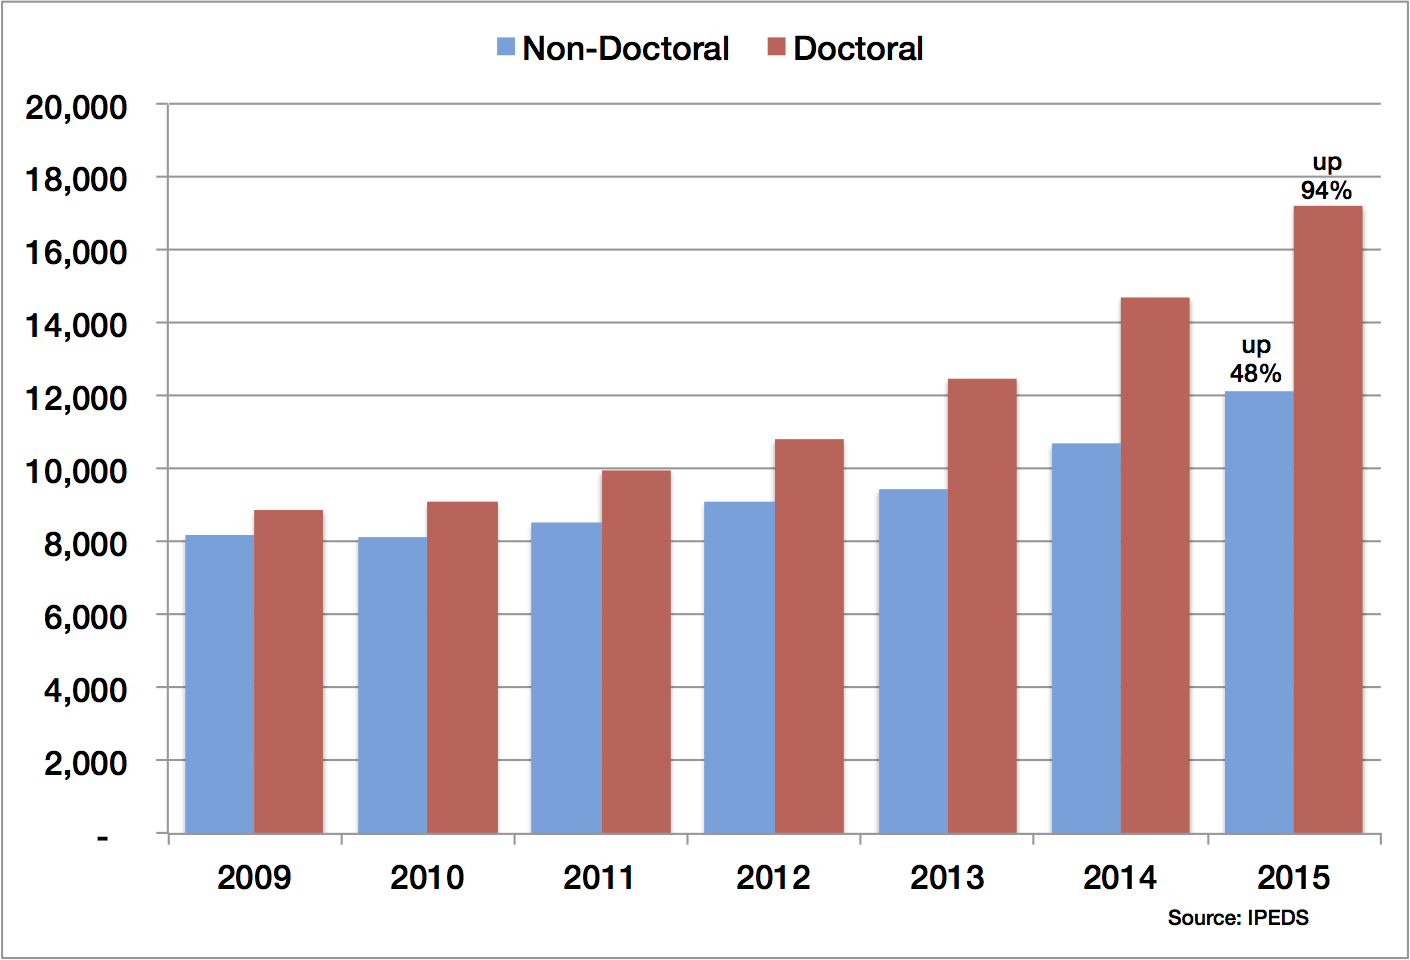
Figure G.1:IPEDS data (CIP 11.0101 and 11.0701) on CS bachelor’s degree completions (2009-2015) for non-doctoral granting units (blue) and doctoral-granting units (red).
Degree Completions by Gender and Ethnicity
Figure G.2 shows IPEDS CS degree completions for four groups — women, Blacks/African Americans, Hispanics/Latinos, and other underrepresented groups (American Indians or Alaska Natives plus Native Hawaiians or Other Pacific Islanders) — as a percentage of total completions for doctoral- and non-doctoral granting units. Figure G.2(a) shows a growth in completions from 2009 to 2015 for three of the four groups (all but Blacks/African Americans). Figure G.2(b) shows a growth in completions for only two of the four groups: Hispanics/Latinos and other underrepresented groups. The percentage of degree completions of Blacks/African Americans declined from 2009 to 2015 in both doctoral- and non-doctoral granting units. The percentage of degree completions by women increased in doctoral-granting units, while this percentage dropped and then recovered somewhat in non-doctoral granting units.
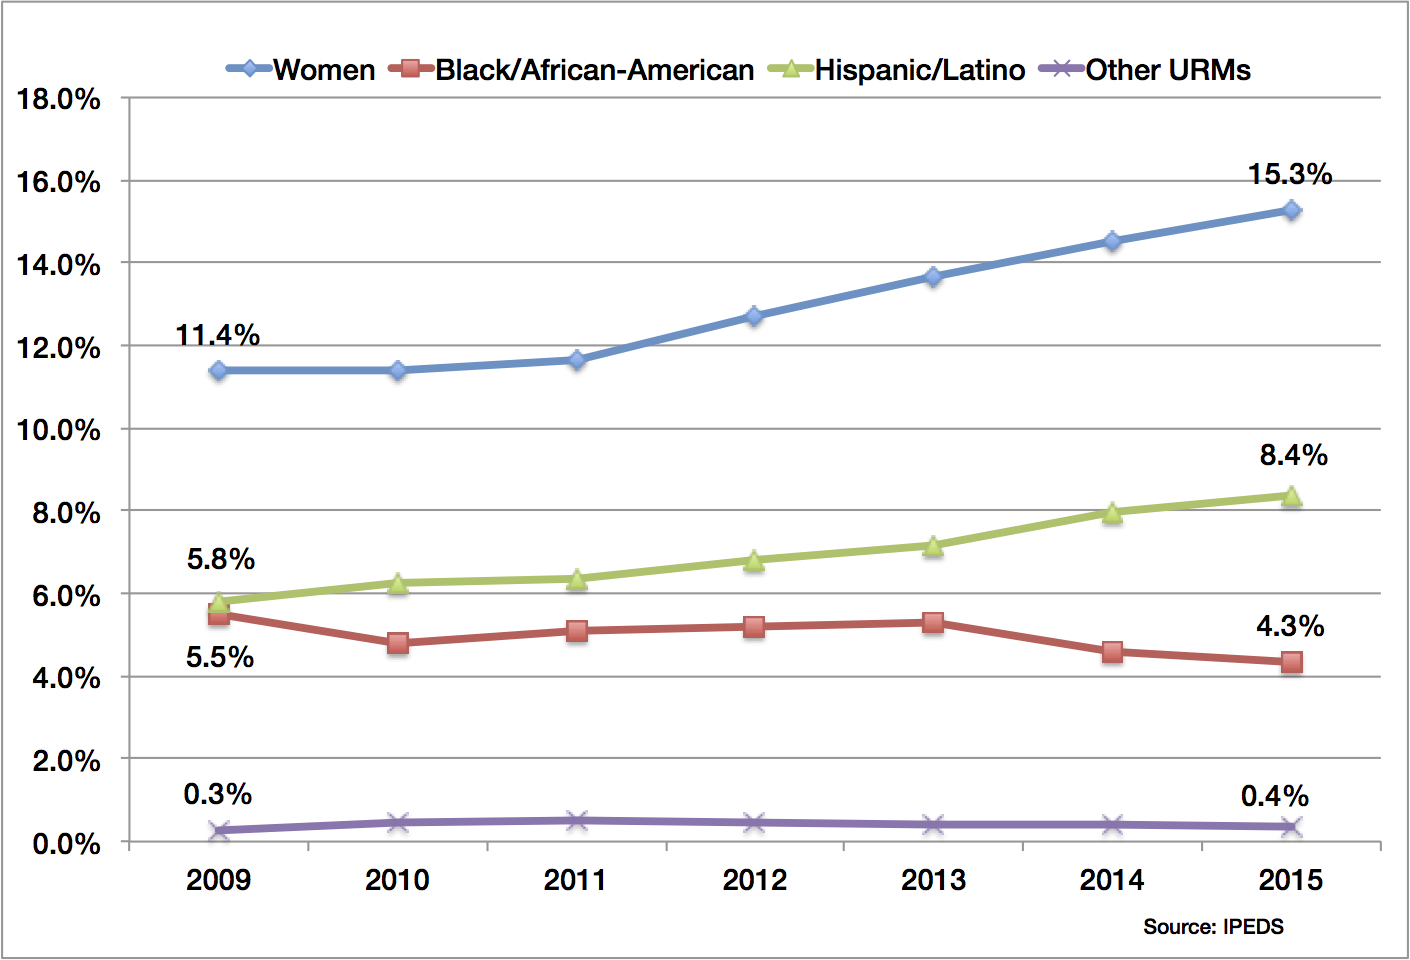
(a) Doctoral-Granting Units
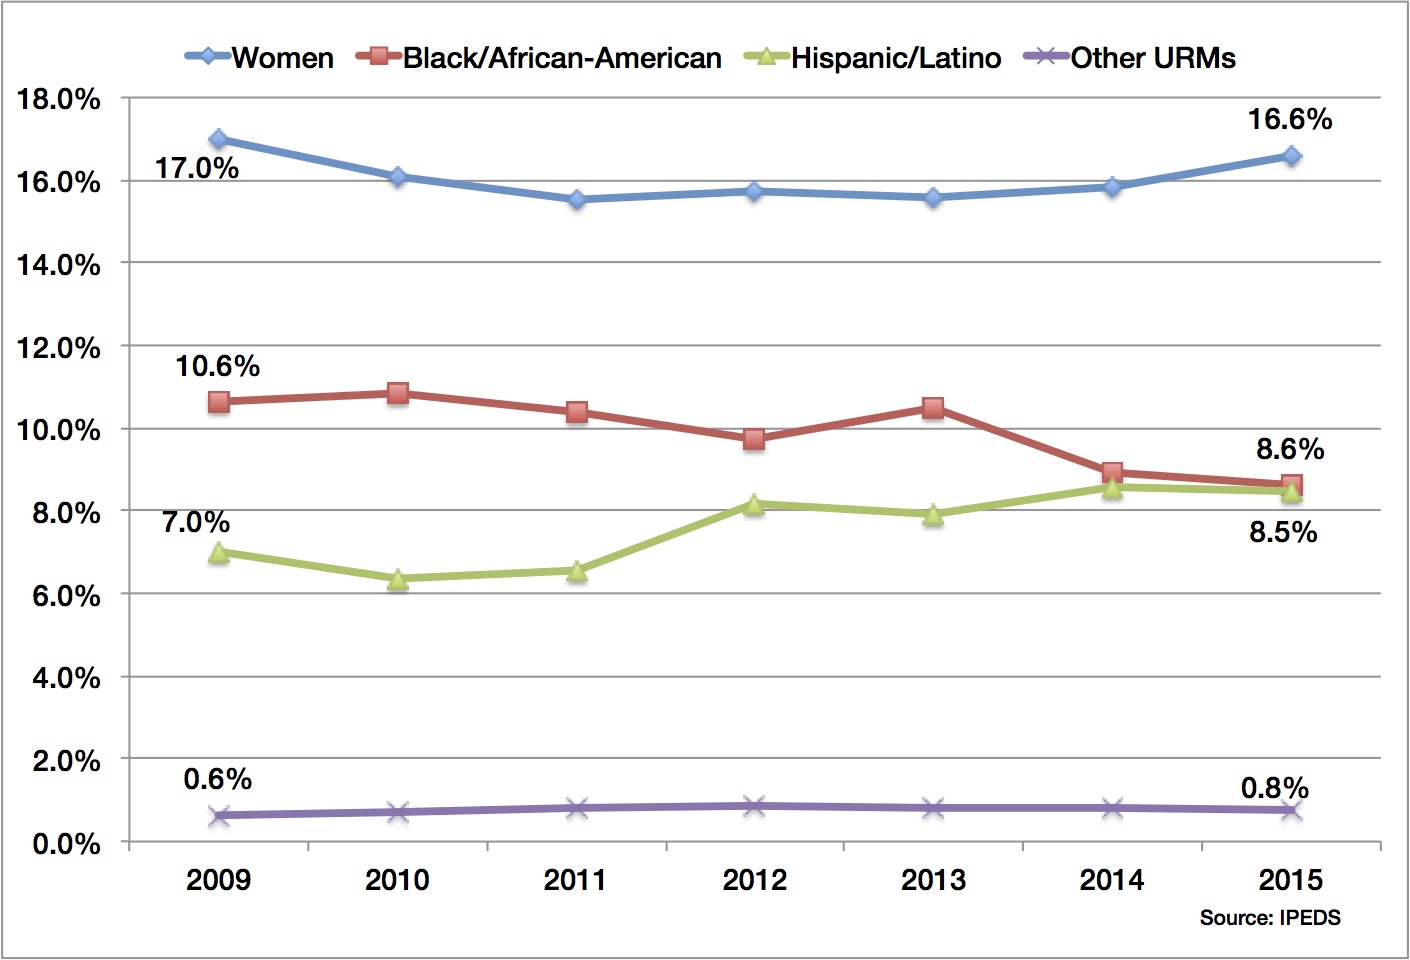
(b) Non-Doctoral Granting Units
Figure G.2: IPEDS CS Diversity Data
Due to the overall increase in CS degree completions, the number of completions by all four groups has grown from 2009 to 2015. Table G.1 shows the increase in the number of IPEDS CS degree completions from 2009 to 2015, separated by non-doctoral and doctoral-granting units. The growth in completions by women (except in non-doctoral granting units), Hispanics/Latinos, and Other Underrepresented groups (American Indians or Alaska Natives plus Native Hawaiians or Other Pacific Islanders) has outpaced the overall growth across both doctoral- and non-doctoral granting units. While the number of IPEDS CS degree completions by Blacks/African Americans has increased, the rate of increase is only approximately one-half of the overall increase.
Table G.1: Increase in Completions 2009-2015
| Numerical Increase | Percentage Increase | ||||
| Non-Doctoral | Doctoral | Non-Doctoral | Doctoral | All | |
| Total | 3,959 | 8,351 | 48% | 94% | 72% |
| Women | 637 | 1,620 | 46% | 160% | 94% |
| Blacks/African-Americans | 183 | 259 | 21% | 53% | 33% |
| Hispanics/Latinos | 463 | 932 | 81% | 181% | 128% |
| Other Underrepresented | 44 | 42 | 85% | 175% | 113% |
Degree Completions at Public vs. Private Institutions
Figure G.3 shows the total number of IPEDS CS degree completions at public and private institutions. The growth in total completions from 2009 to 2015 was much larger for public institutions (79%) than private institutions (58%). Figure G.4 shows IPEDS CS degree completions for women and underrepresented minorities (URMs) at public and private institutions. While private institutions have a larger percentage of women graduating (20% vs. 14%), public institutions still produce more women overall (approximately 2,600 vs. 1,800). Lastly, Figure G.4(b) shows that the IPEDS CS degree completions rate for underrepresented minorities (Blacks/African Americans, Hispanics/Latinos, and Other Underrepresented groups) from 2009 to 2015 has decreased slightly at private institutions and increased slightly at public institutions.
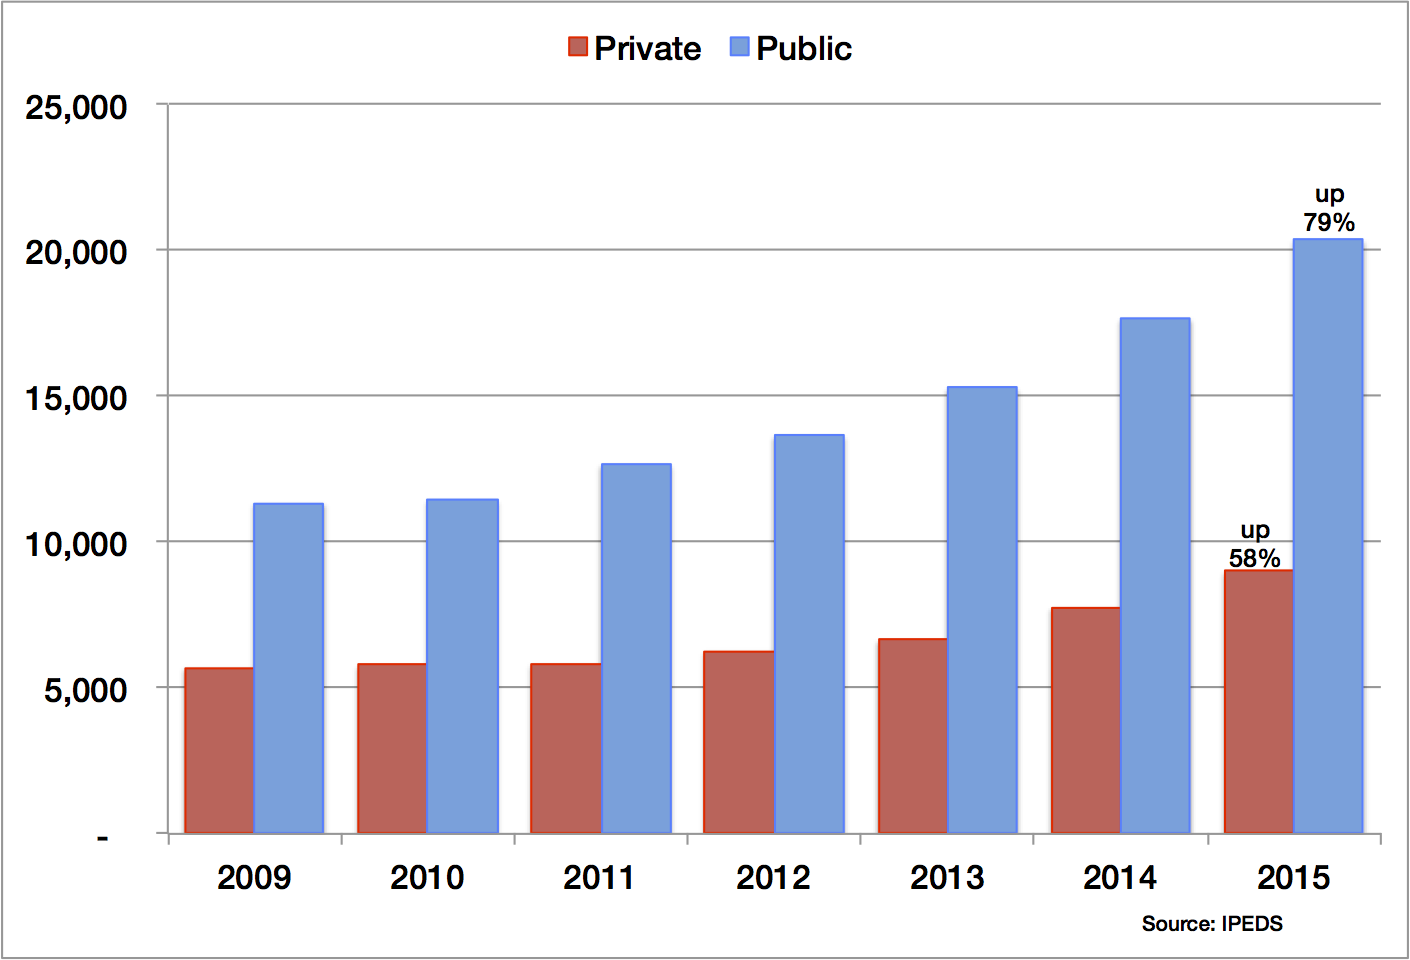
Figure G.3:IPEDS data (CIP 11.0101 and 11.0701) on CS bachelor’s degree completions (2009-2015) for private institutions (red) and public institutions (blue).
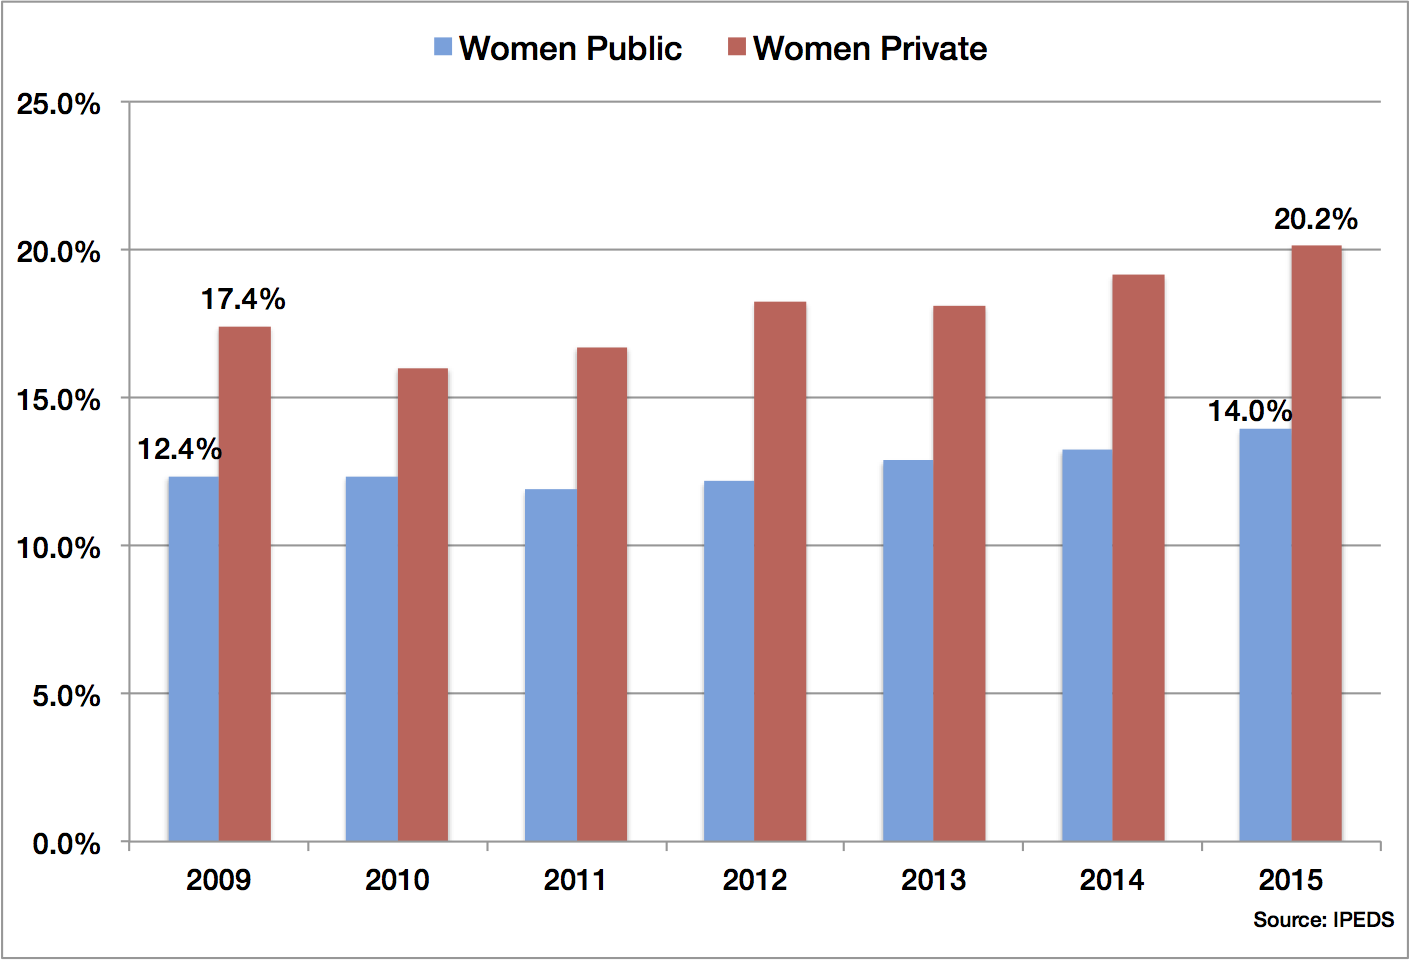
(a) Percentage Completions for Women
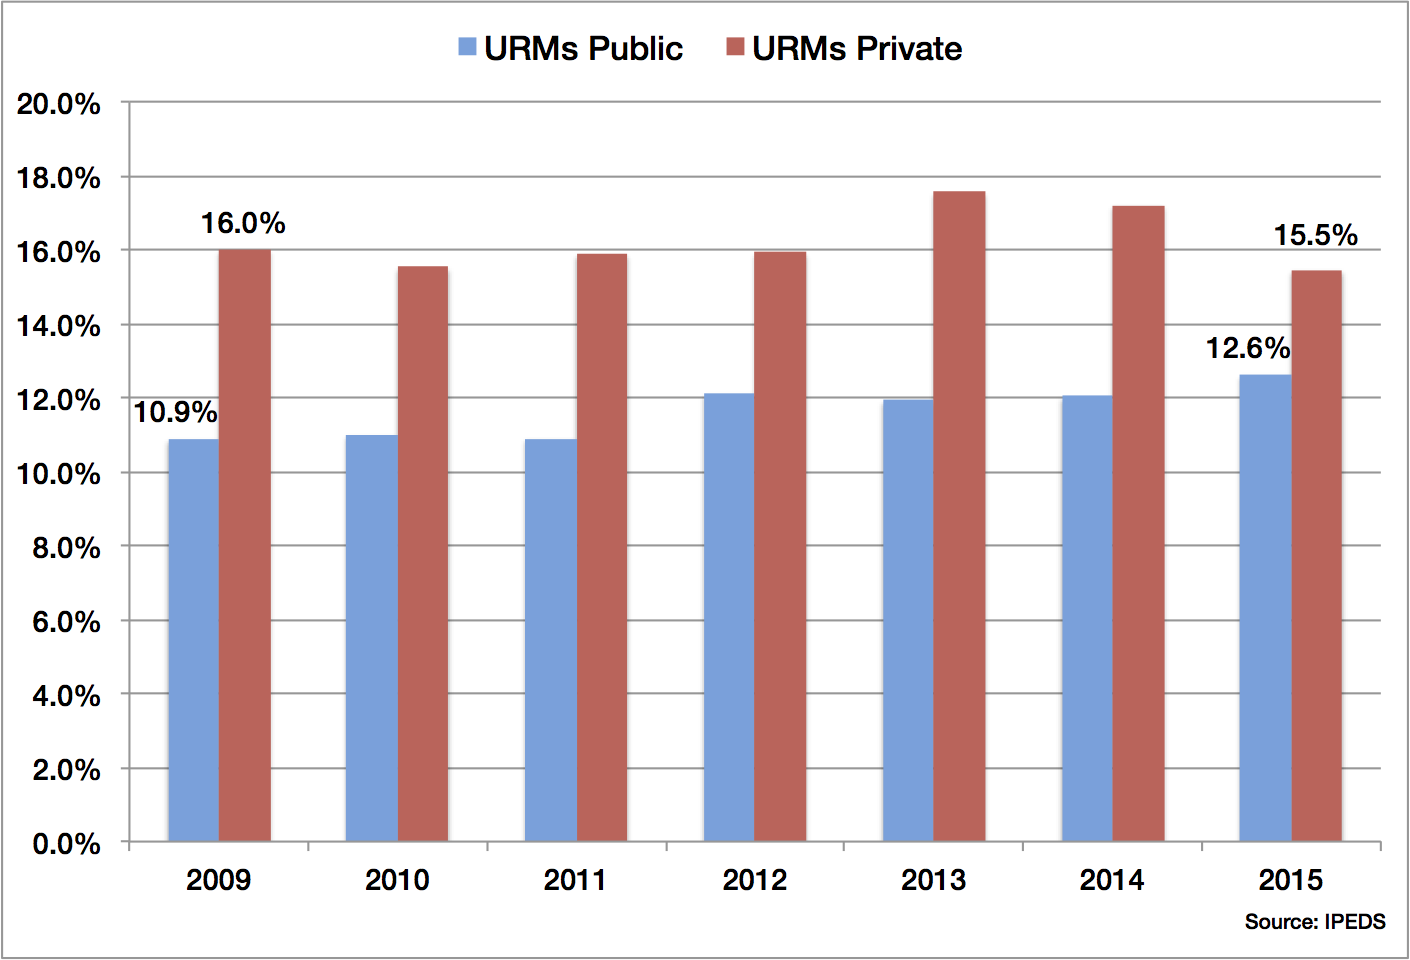
(b) Percentage Completions for URMs
Figure G.4: Diversity in Public and Private Institutions
[1] We use the term “academic unit” or “unit” to denote the administrative division responsible for the CS bachelor’s program. Often, but not always, this is an academic department.
[2] IPEDS doctoral-granting units are institutions that grant at least 20 research/scholarship doctorates in any field (not including professional practice doctoral-level degrees such as JD and MD), following the Carnegie Classification of Institutions of Higher Education. Taulbee and NDC survey data define doctoral- and non-doctoral granting units by whether the unit grants doctorates in computing.

