
CRA Directors Erik Russell and Burçin Tamer featured on the Modern Figures Podcast
CRA Directors Erik Russell and Burçin Tamer share inspiring stories of CRA broadening computing efforts on the Modern Figures Podcast.

CRA Directors Erik Russell and Burçin Tamer share inspiring stories of CRA broadening computing efforts on the Modern Figures Podcast.

CRA will be represented during the upcoming DOE Advanced Scientific Computing Advisory Committee (ASCAC) meeting. Attend CRA session “Taulbee, Talent, and Trends” from 1:00-1:45 PM ET on September 30, 2021.

This article and the accompanying figures and tables present the results from the 50th annual CRA Taulbee Survey, which documents trends in student enrollment, degree production, employment of graduates, and faculty salaries in academic units in the United States and Canada that grant the Ph.D. in computer science, computer engineering, or information.

After twelve years of sustained growth in undergraduate enrollment, there may be signs of a slowdown in that there are, on average, fewer new undergraduate majors in 2019-20 than there were in 2018-19. Nevertheless, the average number of CS majors continued its rise in 2018-19, both in U.S. CS departments and overall.

In advance of the 2019 CRA Taulbee Report, which will be published in the May 2020 issue of CRN next week, we’d like to share a preview of the degree, enrollment, faculty and diversity numbers for bachelor’s and doctoral level programs in the departments responding to the survey.
The 2018 CRA Taulbee Survey will be starting soon. As has been our recent practice, the survey will be split into two parts, salary and main (everything else). This allows us to set an earlier deadline for the salary section in order to produce a preliminary salary report in December, while giving departments more time to collect and enter the information in the rest of the survey if needed.
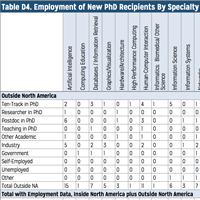
In the report of the CRA Taulbee Survey published in the May 2018 CRN, there is an error in specialty area labeling in Tables D4 (Employment of New PhD Recipients by Specialty) and D4a (Detail of Industry Employment). In both D4 and D4a, the column labels for High Performance Computing and Human Computer Interaction were swapped. In addition, in D4a the column labels in alphabetical sequence between Informatics: Biomedical/Other Science and Social Computing/Social Informatics were incorrect.

This article and the accompanying figures and tables present the results from the 47th annual CRA Taulbee Survey. The survey, conducted annually by the Computing Research Association, documents trends in student enrollment, degree production, employment of graduates, and faculty salaries in academic units in the United States and Canada that grant the Ph.D. in computer science (CS), computer engineering (CE), or information (I). Most of these academic units are departments, but some are colleges or schools of information or computing.

In fall 2017, CRA will be conducting the usual Taulbee Survey and a one-time Teaching Faculty Survey. The Taulbee Survey schedule will be as follows.
If you have any questions, contact Betsy Bizot at bizot@cra.org/cra
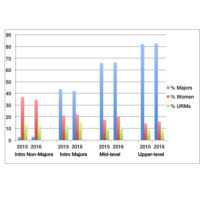
The 2016 Taulbee Survey report, published in the May 2017 issue of CRN, did not include the results of a component that was introduced in the most recent survey–namely, bachelor’s enrollment data from specific courses in the curriculum. This component was introduced as a result of what was learned in the CRA Enrollment Report (see https://cra.org/cra/data/generation-cs). Unfortunately, we were unable to compile the data in time to feature the results in the May issue.
Non-tenure-track teaching faculty are becoming more important to doctoral departments to help them meet their educational goals and responsibilities, particularly in response to the current enrollments surge. In the Generation CS report (available at https://cra.org/cra/data/Generation-CS/), 65% of doctoral departments reported in fall 2015 that they had increased the number of teaching faculty on continuing appointments in response to increased enrollments, and an additional 16% were considering it. Similarly, between fall 2006 and fall 2016, the proportion of Taulbee Survey respondents reporting at least one full-time non-tenure-track teaching faculty member increased from 81% to 87% and, more notably, the median number of such teaching faculty at the departments reporting nonzero counts rose from 3 to 6.
The 2016 CRA Taulbee Survey will be starting soon. As we did last year, the survey will be split into two parts, salary and main (everything else). This allows us to set an earlier deadline for the salary section in order to produce a preliminary salary report in December, while giving departments more time to collect and enter the information in the rest of the survey.
The schedule will be as follows:
By September 9: All doctoral departments will be contacted to update Taulbee user information. The academic unit head will receive an email and so will the Taulbee primary contact, if separate.
September 13: PDF will be available for data gathering.
September 27: Both sections of the Taulbee will open for input.
November 18: Due date for salary section.
December 19: Preliminary salary report available.
January 18, 2017: Due date for the main Taulbee section.
April 2017: Full Taulbee report to CRA members and participating departments.
May 2017: Published in CRN.
If you have any questions, contact Betsy Bizot at bizot@cra.org/cra.
CRA has launched a survey about the significant increases many institutions are seeing in undergraduate computer science course enrollments (often referred to as the enrollment boom). This is a question of deep concern to many in our community. The survey is a unique opportunity to measure, assess, and better understand enrollment trends and their impact […]

News coverage of the wildly popular social media campaign #ILookLikeAnEngineer, often cites CRA data on enrollment statistics.
