Cognitive Disorders are the Most Common Disability Reported by Undergraduate Students in Computing
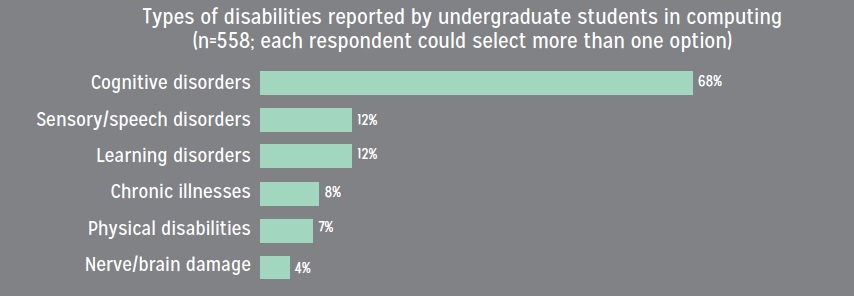
CERP’s 2016 Data Buddies survey collected data on students’ disability status from 6,447 undergraduate students in computing. Eight percent of these students reported having at least one type of disability. This chart illustrates that the most common disabilities are not visible. These data serve as a reminder that some computing students may be faced with an additional set of challenges in and outside of the classroom due to their disability or disabilities.
Notes. The Data Buddies project collected survey data from 7,300 undergraduate students in 2016. Eighty-eight percent (n=6,447) of these students responded to a question asking if they have any type of disability. Of those students, 8% (n=558) reported having at least one type of disability. These students were asked to indicate the type(s) of disabilities they had. In this infographic, options provided in the survey were collapsed into the following six groups: cognitive disorders (n=377; attention deficit hyperactivity disorder [ADHD], autism spectrum disorder, mental illness), sensory/speech disorders (n=68; deaf/hard of hearing, speech or language disability, visual), learning disorders (n=66; specific learning disability, intellectual disability), physical disabilities (n=39; mobility or orthopedic disability), nerve/brain damage (n=25; traumatic brain injury/head injury, nerve damage), and chronic illnesses (n=43). Note that among the 558 students who reported a disability, 25 did not indicate any specific type of disability and were not displayed in the chart here. The categories used here were adapted from AccessComputing and disabled-world.com.
The prevalence of different types of disabilities among the undergraduate students surveyed via Data Buddies roughly aligns with the 18-34 year old U.S. population, based on data from the American Community Survey (ACS). According to the ACS, 6% of 18-34 year olds have a disability (U.S. Census Bureau, 2015). The ACS and Data Buddies record disabilities differently; nevertheless, we present the ACS data for interested readers. The distribution of different types of disabilities as a percentage of the individuals with a disability in this age group are reported by ACS as follows: cognitive difficulty: 63%; independent living difficulty: 38%; ambulatory difficulty: 23%; vision difficulty: 18%; self-care difficulty: 14%; hearing difficulty: 14%.
References.
Disabled World. Disability: Definition, Types and Models. Retrieved on 3/24/2017 from https://www.disabled-world.com/disability/types/
The Alliance for Access to Computing Careers (AccessComputing). Accommodations by Disability Type. Retrieved on 3/24/2017 from https://www.washington.edu/accesscomputing/resources/accommodations/accommodations-disability-type
U.S. Census Bureau (2015). American Community Survey 1-Year Estimates. Retrieved on 3/24/2017 from https://factfinder.census.gov.
 This infographic is brought to you by the CRA’s Center for Evaluating the Research Pipeline (CERP). CERP provides social science research and comparative evaluation for the computing community. To learn more about CERP, visit our website at https://cra.org/cerp/. To subscribe to the CERP newsletter, click here.
This material is based upon work supported by the National Science Foundation under Grant Number (CNS-1246649; and/ or DUE-1431112). Any opinions, findings, and conclusions or recommendations expressed in this material are those of the author(s) and do not necessarily reflect the views of the National Science Foundation.