Students With Disabilities Report Differing Feelings of Belonging in Computing than Their Peers
The feeling of belonging in one’s field is connected to one’s future academic success and persistence. [e.g. 1] CERP analyzed the results of the Fall 2019 Data Buddies Survey (DBS) for undergraduate and graduate students to understand how students with disabilities report feelings of belonging.
CERP asked participants to rate their level of agreement with the following statements: “Computing is a big part of who I am”, “I feel welcome in computing”, and “I feel like I belong in computing.” CERP analyzed these responses via Independent Samples t-tests, grouping students by whether they indicated “yes” or “no” to the question: “Do you have any type of disability?” The analyses included only those students who provided answers to each of the above statements, and further grouped students by whether the students were currently earning an undergraduate (N = 8,333), terminal master’s (N = 1,278), or doctoral degree (N = 1,158).
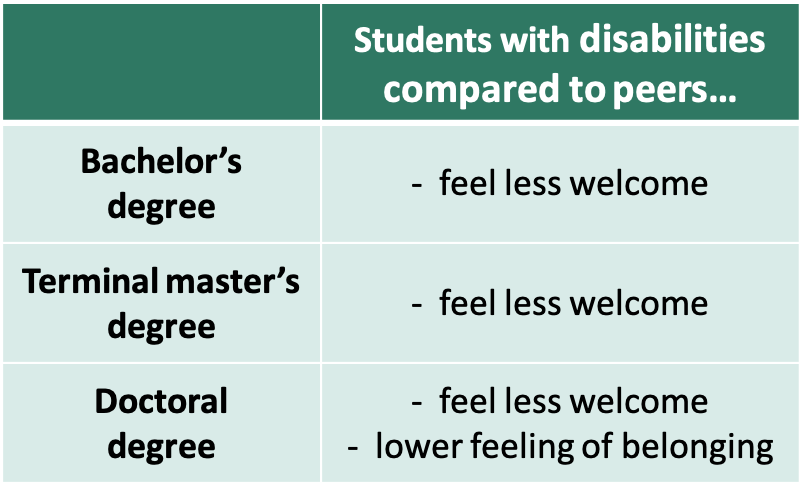
Results indicate mixed experiences. On one hand, t-tests comparing the responses for “Computing is a big part of who I am” were all non-significant for 1) undergraduate students with and without disabilities, 2) terminal master’s students with and without disabilities, and 3) doctoral students with and without disabilities. These results indicate that students in each of these degree levels, regardless of disability status, have generally equivalent levels of feeling that computing is a big part of who they are. Given those equivalent feelings, it is troubling to uncover that undergraduates with disabilities, terminal master’s students with disabilities, and doctoral students with disabilities each reported a significantly lower sense of feeling welcomed in computing than their peers. Furthermore, doctoral students with disabilities additionally reported significantly lower feelings of belonging in computing than their peers. See the Notes section for more details.
While these results highlight some disparities in experiences of students with disabilities, there is also a need for careful follow-up analyses. While this first level of analysis used disability status as a binary grouping variable, disabilities range widely. Future work should investigate whether a sense of belonging differs for students with different types of disabilities (e.g. those with mobility-related disabilities versus those with health-related disabilities).
Reference:
- Freeman, T. M., Anderman, L. H., & Jensen, J. M. (2007). Sense of belonging in college freshmen at the classroom and campus levels. The Journal of Experimental Education, 75(3), 203-220.
Notes:
The survey data analyzed for this infographic were collected by Center for Evaluating the Research Pipeline via The Data Buddies Project in 2019. Each of the items analyzed in this analysis used a 1-5 Likert scale, with the choices of “Strongly disagree”, “Somewhat disagree”, “Neither agree nor disagree”, “Somewhat agree”, and “Strongly Agree”.
Significant Independent Samples t-tests with effect sizes (Cohen’s d) over 0.15:
- Doctoral students with disabilities (M = 3.57; SD = 1.18) report lower feelings of belonging in computing than doctoral students without disabilities (M = 3.91, SD = 1.01); t(113) = -2.78, p < 0.1; Cohen’s d = 0.31.
- Undergraduate students with disabilities (M = 3.49, SD = 1.08) report lower feelings of welcome in computing than undergraduate students without disabilities (M = 3.66, SD = 0.98); t(998) = -4.33, p < 0.001, Cohen’s d = 0.16.
- Terminal master’s students with disabilities (M = 3.61, SD = 1.03) report lower feelings of welcome in computing than terminal master’s students without disabilities (M = 3.93, SD = 0.94); t(61) = -2.24, p < 0.05, Cohen’s d = 0.32
- Doctoral students with disabilities (M = 3.51, SD = 1.10) report lower feelings of welcome in computing than doctoral students without disabilities (M = 3.81, SD = 0.95); t(114) = -2.68, p < 0.01, Cohen’s d = 0.30.
 This analysis is brought to you by the CRA’s Center for Evaluating the Research Pipeline (CERP). CERP provides social science research and comparative evaluation for the computing community. Subscribe to the CERP newsletter here. Volunteer for Data Buddies by signing-up here.
This material is based upon work supported by the National Science Foundation under grant numbers CNS-1246649, DUE-1431112, and/or DUE-1821136. Any opinions, findings, and conclusions or recommendations expressed in this material are those of the author(s) and do not necessarily reflect the views of the National Science Foundation.