Exploring the Baccalaureate Origin of Domestic Ph.D. Students in Computing Fields
1. Introduction
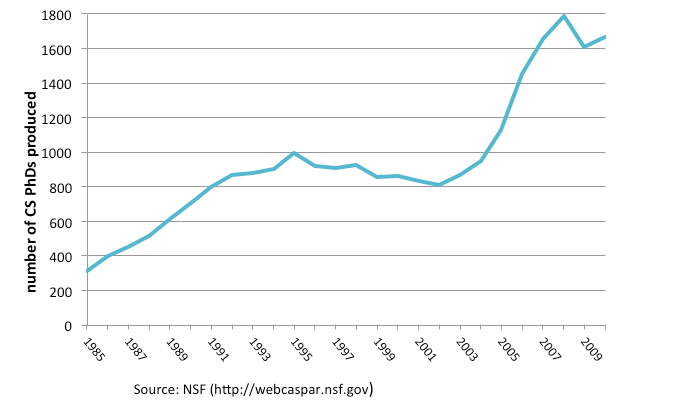
Increasing the number of US students entering graduate school and receiving a Ph.D. in computer science is a goal as well as a challenge for many US Ph.D. granting institutions. Although the total computer science Ph.D. production in the U.S. has doubled between 2000 and 2010 (Figure 1), the fraction of domestic students receiving a Ph.D. from U.S. graduate programs has been below 50% since 2003 (Figure 2).
Figure 1:Total Ph.D. Production in Computer Science from 1985 to 2010
The goal of the Pipeline Project of CRA-E (PiPE) is to better understand the pipeline of US citizens and Permanent Residents (henceforth termed domestic students) who apply, matriculate, and graduate from doctoral programs in computer science. This article is the first of two articles from CRA-E examining this issue.
This article provides an initial examination of the baccalaureate origins of domestic students who have matriculated to Ph.D. programs in computer science. We hope that trends and patterns in these data can be useful both in recruiting and, ultimately, in improving the quality and quantity of the domestic Ph.D. pipeline.
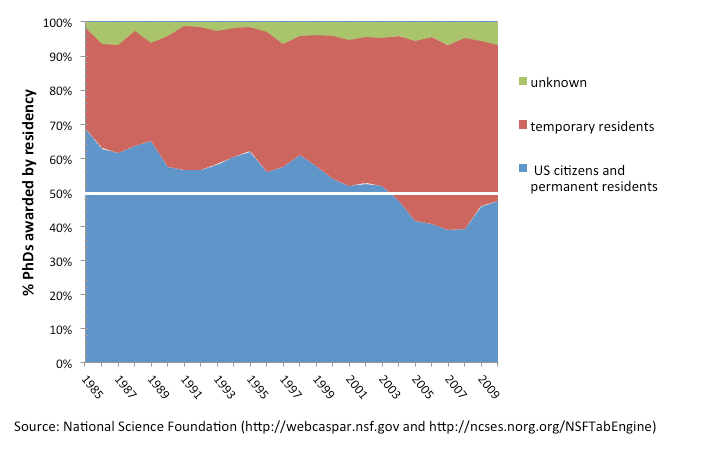
Figure 2: Percent of Ph.D.’s Awarded to Temporary Residents (i.e., international students) and U.S. Citizens/Permanent Residents from 1985 to 2010
2. Sources of Data
We used the following publically available data sources:
· NSF’s WebCASPAR (https://WebCASPAR.nsf.gov/)
· The National Center for Science and Engineering Statistics (NCSES), formerly NSF’s Division of Science Resources Statistics (http://www.nsf.gov/statistics/)
· NSF Graduate Research Fellowship awardees and honorable mentions from FastLane (https://www.fastlane.nsf.gov/grfp/AwardeeList.do?method=loadAwardeeList)
Figure 1 shows the number of Ph.D.’s awarded in the U.S. in computer science from 1982 to 2010 as reported by WebCASPAR. Another data source for Ph.D. production is the Taulbee report released annually by the CRA and available at http://www.cra.org/resources/taulbee/. The Taulbee data on Ph.D. production complements WebCASPAR data. Taulbee provides Ph.D. production for institutions in the US and Canada and considers degrees in computer science, computer engineering and information science. We note that Taulbee data only includes CRA member institutions and thus omits some institutions in the WebCASPAR dataset, but counts Ph.D.s in related computing fields which is difficult to capture with WebCASPAR. We refer to Counting Computing: CRA Taulbee Survey and NSF Statistics for a detailed comparison. Although the Taulbee and WebCASPAR datasets differ, they do show similar trends.
We use the 2010 Carnegie classification (http://classifications.carnegiefoundation.org/) for grouping institutions and consider for five groups: Research Universities (297), master’s institutions (727), four-year Colleges (810), other/unknown and non-Carnegie institutions. The number in the parenthesis for the first three groups indicates the number of institutions in that group. Other/Unknown includes a small number of institutions that don’t fit into the other categories and non-Carnegie institutions refer to institutions outside the US.[1] While this is an admittedly coarse partitioning, it provides a valuable overview and shows some important trends and patterns.
The main objective of this report is to provide insight into the undergraduate origins of domestic Ph.D. students. Where data sources fail to provide breakdowns by residency status, we have used a domestic bachelor’s degree as a proxy for “domestic student.” This will fail to identify the small numbers of domestic students who received their undergraduate educations outside the U.S. or of international students who received their undergraduate educations at U.S. institutions. We believe these limitations are modest and do not detract from the overall findings of this report.
3. Summary of Findings
The following is a summary of our findings:
· In 2010, over 70% of the Ph.D.’s awarded to domestic students went to students who completed their undergraduate studies at research universities, 15% at master’s institutions, 11% at four-year colleges, and about 4% from the other/unknown category. These percentages have not changed much since 2000.
· The percentage of students completing a Ph.D. within six years of completion of their undergraduate degree is approximately:
- 2.5% for graduates from research universities
- 1.0% for graduates from four-year colleges
- 0.5% for graduates from master’s institutions
- A small number of baccalaureate institutions produce a large number of undergraduates who go on to get Ph.D.’s in computer science. For example, more than 10% of domestic students obtaining Ph.D.’s in computer science received their undergraduate degrees at just four institutions (MIT, Berkeley, CMU, and Cornell).
· Approximately 50% of domestic Ph.D. students come from 54 institutions of baccalaureate origin and the other 50% come from over 747 institutions.
· The top 25 liberal arts colleges (according to the U.S. News and World Report ranking) collectively produce a significant fraction of domestic students receiving a Ph.D., exceeding the production of any single university.
· NSF Graduate Fellowship awards can be viewed as a proxy for “top” students. Since 2003, graduates of research universities receive 80-90% of the awards. Graduates of five institutions each received between 4 and 5% of the awards for a total of over 20% of all awards. Collectively, graduates of the top 25 liberal arts colleges received approximately 6% of the awards.
4. Findings in Detail
4.1 Domestic “Production”
For the last two decades, U.S. research universities and master’s institutions have produced roughly the same number of undergraduate degrees in computer science. Together, these two classes of institutions account for almost 90% of all undergraduate degrees awarded. Four-year colleges account for about 10% of degrees (Figure 3).
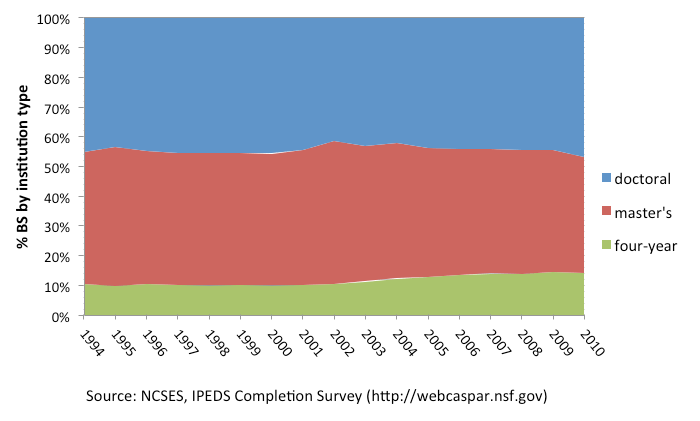
Figure 3: Percentage of domestic bachelor degrees awarded in computer science by type of institution
Figure 4 uses the same data as Figure 3 and shows the actual numbers of degrees awarded.
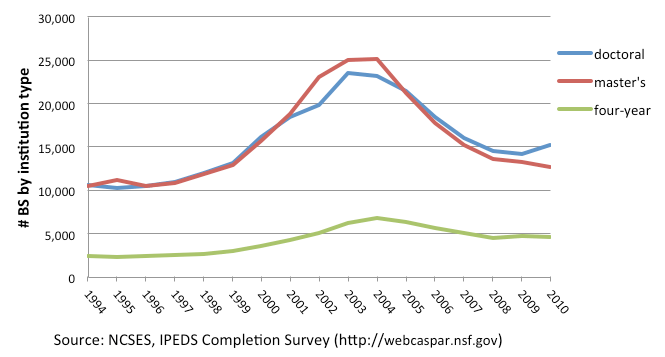
Figure 4: Number of domestic undergraduate degrees awarded in computer science by type of institution.
Next, we use WebCASPAR data to examine the baccalaureate origins of all students receiving Ph.D.’s in computer science in the U.S. In 2010, 1665 Ph.D.’s were awarded in computer science of which 714 went to domestic students. Approximately 71% of the domestic Ph.D.’s received their undergraduate degrees from research universities, 15% from master’s institutions, 11% from four-year colleges, and 4% from other colleges. These proportions have remained essentially unchanged since 2000 with all four types seeing similar increases since 2005. These data are summarized in Figure 5.
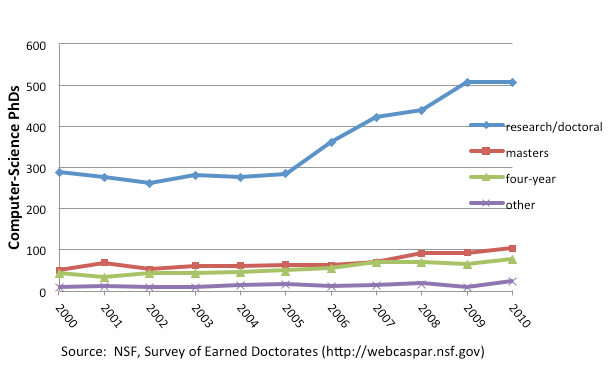
Figure 5:Computer Science Ph.D.’s granted to domestic students by type of baccalaureate institution
While research and master’s institutions have consistently produced approximately the same number of computer science undergraduates, the representation of their undergraduates among Ph.D. recipients differs considerably, as evident from Figure 5.
Figure 6 considers the domestic undergraduate-to-PhD pipeline for research, master’s, and 4-year institutions by relating the total number of students receiving an undergraduate computer science degree to the number of Ph.D.’s in computer science within 6 years of completion of undergraduate studies. The figure is based on Ph.D.s received between 2000 and 2010 and assumes that each recipient received the baccalaureate degree six years earlier. While the fractions are very small for each type of institution, research universities produce students at a rate that is more than twice as high as four-year colleges and roughly five times as high as master’s institutions.
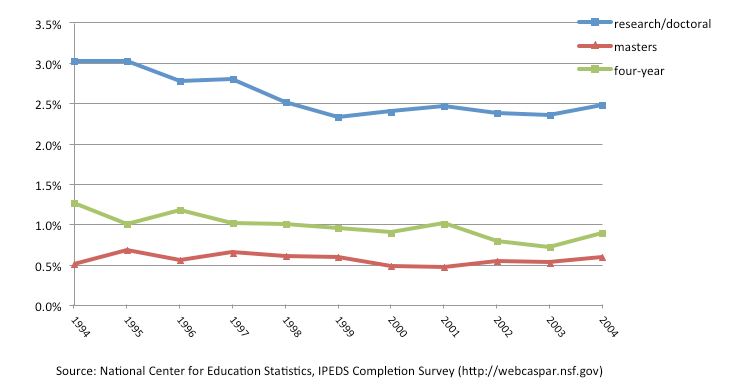
Figure 6: Percentage of domestic CS students who complete a PhD within 6 years of completing undergraduate studies by type of baccalaureate institution of origin. Horizontal axis indicates year of completion of undergraduate studies.
In the eleven year period from the beginning of 2000 to the end of 2010, a total of 5,257 domestic students received a baccalaureate degree and a Ph.D. in computer science from a U.S. institution. A total of 801 U.S. institutions awarded baccalaureate degrees to these 5,257 students. For each of these 801 baccalaureate institutions, we divided the total number of its graduates who received Ph.D.’s during that time by 11 to obtain an average annual production number over that period.
Only one institution (MIT) had an annual average production of 15 or more undergraduates. Three other institutions (Berkeley, CMU, and Cornell) had an average production of more than 10 but less than 15. Together, these four baccalaureate institutions accounted for over 10% of all Ph.D.’s awarded to domestic students. The next 10% of all Ph.D.’s in that period came from only eight other baccalaureate institutions (Harvard, Brigham Young, Stanford, UT Austin, UIUC, Princeton, University of Michigan, and UCLA). In total, 54 (6.7%) of the 801 baccalaureate institutions accounted for 50% of the total Ph.D. production. The average annual production numbers are summarized in Figure 7.
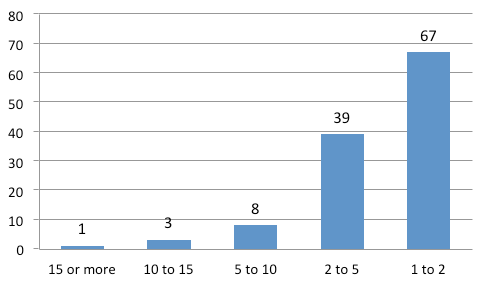
Figure 7: The number of institutions with annual average productions of 15 or more, at least 10 but less than 15, at least 5 but less than 10, at least 2 but less than 5, at least 1 but less than 2.
Highly selective four-year colleges are an important source of the domestic Ph.D. production. Since most of these schools have very small enrollments, we examined them collectively. The top 25 liberal arts colleges (using the U.S. News and World Reports ranking) collectively enroll slightly less than 50,000 students per year in all majors and were the origins of 190 Ph.D. degrees between 2000 and 2010, collectively ranking ahead of any single research university.
In spite of the fact that a small number of baccalaureate institutions account for a large fraction of the domestic Ph.D.’s, nearly 18% of all Ph.D.’s came from baccalaureate with an average annual production of less than 2.
4.2 Baccalaureate Origins of NSF Graduate Research Fellowships Awardees/Honorable Mentions
NSF Graduate Research Fellowship (GRF) awardees provide a proxy for “top” domestic graduate students. We note that this is an imperfect measure, because it is based on NSF’s eligibility criteria and specific merit review criteria (see http://www.nsf.gov/pubs/2012/nsf12599/nsf12599.htm). NSF FastLane provides data on the baccalaureate institutions for students receiving awards and honorable mentions and this section examines baccalaureate institutions based on the Carnegie classifications. We examine only the institution of baccalaureate origin and not the institution from which a student ultimately receives the Ph.D.
Since 2010, approximately 2000 GRF awards were made per year across all eligible disciplines. The number of awards allocated to a discipline is generally determined by the total number of applications from that discipline. For NSF’s Directorate for Computer and Information Science and Engineering (CISE), the number of GRF applications has increased from about 450 in 2006 to 650 in 2011 and the award rate has increased from 12 to 17%. When honorable mentions are included, the success rate increases to approximately 30%.
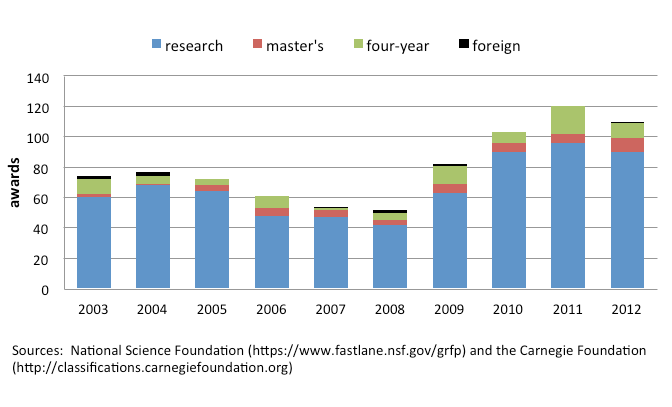
Figure 8: CISE GRF Awards by Type of Baccalaureate Institutions
Figure 8 shows the baccalaureate institution types for CISE awards. Note that only domestic students are eligible for NSF GRF awards, but some domestic awardees attended foreign baccalaureate institutions. Approximately 80-90% of all awards were made to students who completed their undergraduate studies at research universities, which is somewhat higher than their representation (76%) in graduate programs overall. Over the last ten years, students from four-year colleges received 10% of the GRF fellowships (they represent about 11% of students receiving a Ph.D.). Students from master’s institutions received fewer than 6% even though they represent about 15% of the Ph.D.’s and 40% of all undergraduate degrees.
From 2003-2012, 805 NSF GRFs were awarded to students from 222 baccalaureate institutions. Approximately 51% of the awards and 51% of the honorable mentions went to students from 22 baccalaureate institutions shown in Table 1. One four-year institution, Harvey Mudd College, is represented in the top 22 institutions.
| Institution |
Awards |
Honorable Mentions |
| Massachusetts Institute of Technology |
44 |
41 |
| Carnegie Mellon University |
39 |
45 |
| Stanford University |
36 |
31 |
| University of California, Berkeley |
30 |
52 |
| Harvard University |
28 |
24 |
| Princeton University |
27 |
26 |
| Georgia Institute of Technology |
22 |
20 |
| University of Washington |
21 |
27 |
| California Institute of Technology |
18 |
13 |
| The University of Texas at Austin |
18 |
11 |
| Cornell University |
15 |
38 |
| University of Virginia |
15 |
10 |
| University of Illinois at Urbana-Champaign |
13 |
16 |
| University of Michigan |
13 |
14 |
| Rice University |
11 |
16 |
| Duke University |
10 |
6 |
| Harvey Mudd College |
9 |
13 |
| University of California, San Diego |
9 |
11 |
| Rensselaer Polytechnic Institute |
9 |
11 |
| Yale University |
9 |
8 |
| University of California, Irvine |
9 |
7 |
| Washington University in St Louis |
9 |
5 |
| Subtotal (top 22) |
414 |
445 |
| All other institutions (200) |
391 |
424 |
| TOTAL |
805 |
869 |
Table 1: Undergraduate Institutions of Students Receiving a GRF Award or Honorable Mention
Between 2003 and 2012
The top 12 four-year institutions (out of 46 4-year institutions) are listed in Table 2. Collectively, they received 46 fellowships and 47 honorable mentions, making them a group larger than any single institution in Table 1.
| Institutions |
Awards |
Honorable mentions |
| Harvey Mudd College |
9 |
13 |
| Franklin W. Olin College of Engineering |
7 |
4 |
| Swarthmore College |
5 |
9 |
| Williams College |
3 |
10 |
| Middlebury College |
3 |
2 |
| Carleton College |
3 |
1 |
| Amherst College |
3 |
1 |
| Pomona College |
3 |
0 |
| United States Military Academy |
2 |
2 |
| Oberlin College |
2 |
2 |
| Bryn Mawr College |
2 |
2 |
| Haverford College |
2 |
1 |
| Wellesley College |
2 |
0 |
| Subtotal (top 13) |
46 |
47 |
| All other four-year colleges (34) |
34 |
29 |
| TOTAL |
80 |
76 |
| all institutions |
805 |
869 |
Table 2: 4-year Colleges Whose Graduates Received a GRF Award or Honorable Mention
Between 2003 and 2012
5. Conclusions
This study examined the baccalaureate origins of domestic Ph.D. students in computer science. Perhaps the single most striking finding is that a small number of research universities and highly selective colleges are the undergraduate schools of origin for a large fraction of domestic Ph.D. students and NSF Graduate Research Fellowship recipients. However, a very large number of institutions send an average of between one and five students to graduate school each year and their impact on the domestic pipeline is important.
These results suggest that there are a number of opportunities for increasing the number and quality of domestic students going on to Ph.D. programs. Master’s institutions appear to be an underutilized source of prospective graduate students. Efforts to encourage students from these schools to apply to graduate school could have a significant positive impact on the domestic pipeline. While some of the most prolific domestic producers are top-ranked institutions, many remarkably successful institutions are smaller and/or less well known. Identifying and disseminating some of the features of these successful producers can have a positive impact on the domestic Ph.D. pipeline.
This study did not explore recruiting and admissions practices and their potential impact on the production of domestic Ph.D. students. A second article from CRA-E will explore these phenomena and will appear in CRN in the near future.
[1] For the purposes of this study, the Frank W. Olin College of Engineering is considered a four-year college, and Rose-Hulman Institute of Technology is classified as a master’s institution.


