Why Do Undergraduate and Graduate Students Choose Computing?
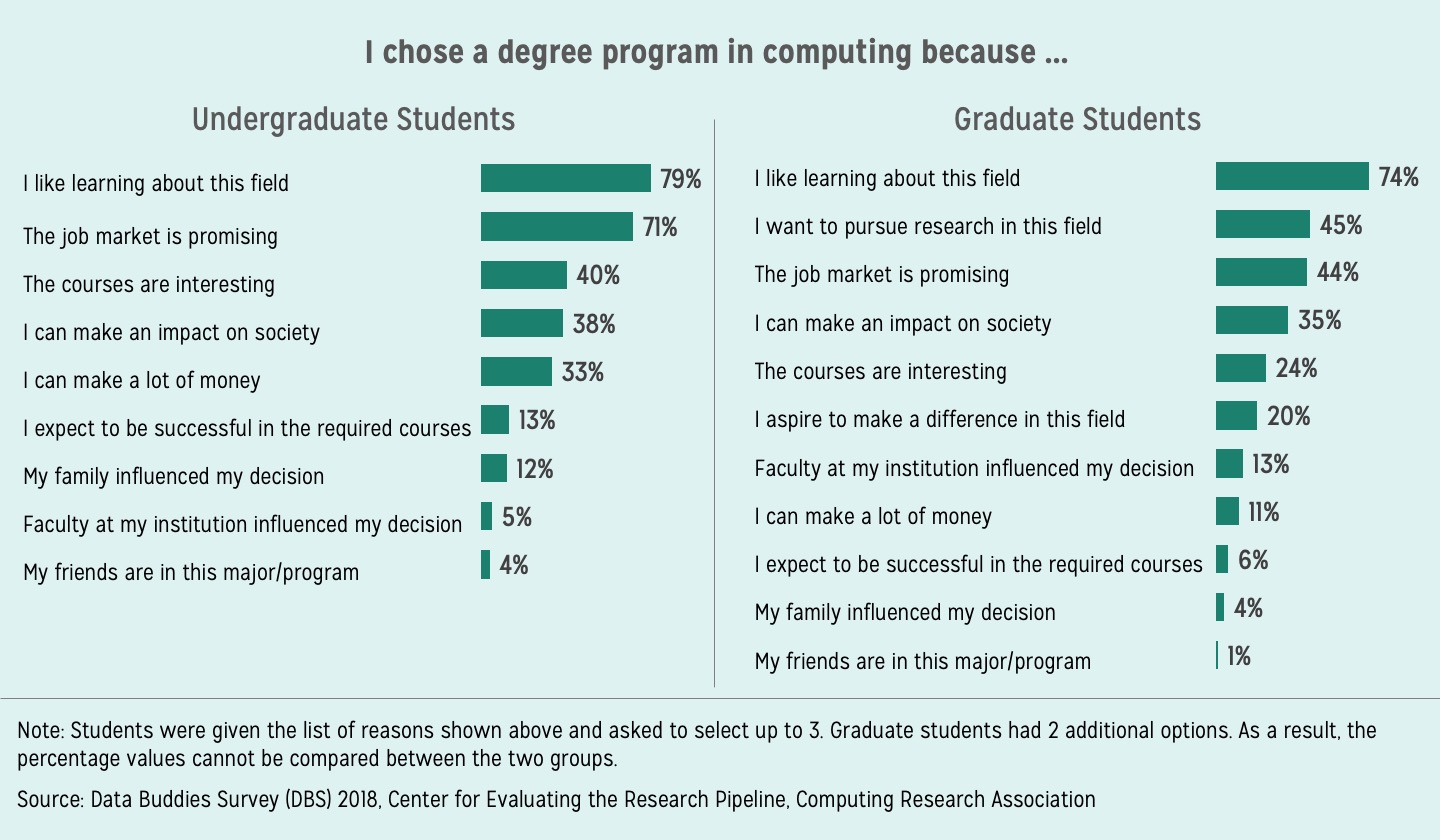
This graphic shows the percentage of undergraduate and graduate students who selected each of the reasons for enrolling in a computing degree program. The most frequently selected reason for both undergraduate (79%) and graduate students (74%) is their interest in learning about the field of computing. Interestingly, the relative rankings of reasons that both groups selected are similar overall. A promising job market was in the top three most frequently selected reasons for choosing a computing degree program for both groups. Similarly, making an impact on society was also ranked highly by both undergraduate and graduate students. On the other hand, influence of friends and family were the least frequently selected reasons for both groups. One notable exception to the similarities in the ranking of the reasons is the relative importance of faculty on graduate students’ interest in a computing degree program compared to that on undergraduate students.
These data indicate that interest in the field, job prospects, and a desire to make an impact on the society are the most common reasons for why students choose to enroll in a computing degree program at both undergraduate and graduate level. An understanding of these factors can not only help departments’ recruitment efforts but also guide strategies for student retention. Further, despite being selected by only 13% of all graduate students, the higher ranking of the influence of faculty by graduate students compared undergraduates suggest that role models and mentorship may play an important role in recruiting students to graduate degree programs in computing.
Notes:
The survey data used in this chart were collected during fall 2018 by CERP via the Data Buddies Project. The sample includes 8,035 undergraduate and 3,058 graduate students in a computing degree program. Students were asked to select up to three reasons for why they chose to enroll in a computing major/degree program. Graduate students had two additional options. As a result, the percentage values cannot be compared between the two groups.
 This analysis is brought to you by the CRA’s Center for Evaluating the Research Pipeline (CERP). CERP provides social science research and comparative evaluation for the computing community. Subscribe to the CERP newsletter here.
This material is based upon work supported by the National Science Foundation under grant numbers (CNS-1246649, CNS 1840724, DUE-1431112, and DUE 1821136). Any opinions, findings, and conclusions or recommendations expressed in this material are those of the author(s) and do not necessarily reflect the views of the National Science Foundation.


