CCC @ AAAS: How Big Trends in Computing are Shaping Science – Part One
By Catherine Gill, Program Associate, CCC
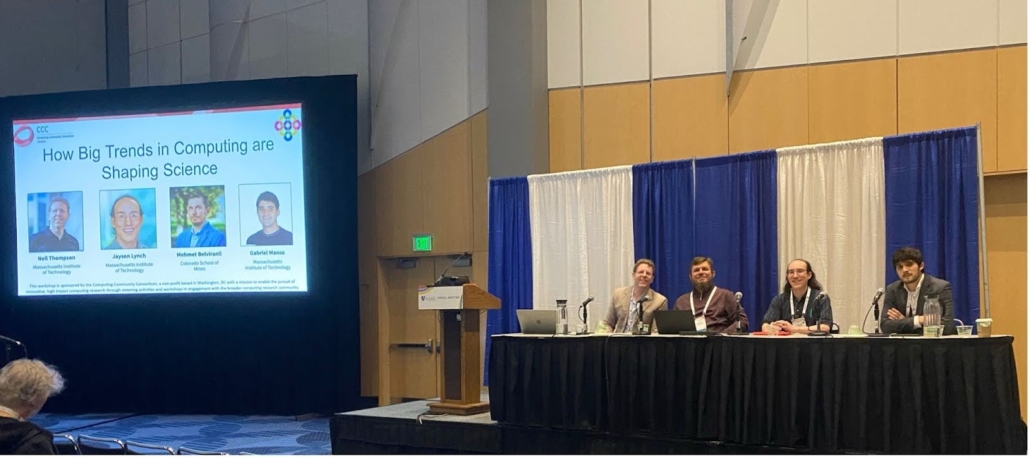
Panelists at the 2024 AAAS Annual Meeting. From Left to Right: Neil Thompson (Massachusetts Institute of Technology), Mehmet Belviranli (Colorado School of Mines), Jayson Lynch (Massachusetts Institute of Technology), and Gabriel Manso (Massachusetts Institute of Technology).
CCC supported three scientific sessions at this year’s AAAS Annual Conference, and in case you weren’t able to attend in person, we are recapping each session. This week, we will summarize the highlights of the session, “How Big Trends in Computing are Shaping Science.” In Part 1, we will hear from Dr. Neil Thompson, from the Massachusetts Institute of Technology, who will explain the computing trends shaping the future of science, and why they will impact nearly all areas of scientific discovery.
CCC’s third AAAS panel of the 2024 annual meeting took place on Saturday, February 17th, on the last day of the conference. The panel, comprised Jayson Lynch (Massachusetts Institute of Technology), Gabriel Manso (Massachusetts Institute of Technology), and Mehmet Belviranli (Colorado School of Mines), and was moderated by Neil Thompson (Massachusetts Institute of Technology).
Neil Thompson, director of the FutureTech project at MIT, kicked off the panel by giving background on the specific trends in computing that the panel intended to focus on, those being the end of Moore’s Law and the rise of Artificial Intelligence. “Throughout this panel”, said Dr. Thompson, “we will discuss how these trends are shaping not only computing but much of scientific discovery.” Weather prediction, for example, is something computers have been used on for a very long time. Back in the 1950s, researchers began to use computers for weather prediction, and the graph below displays the power of the systems NOAA used to make these predictions over time. The Y axis shows the computing power, and each jump on the graph is a factor of 100. “Over this period from 1955 to 2019”, said Dr. Thompson, “we have had about one trillion-fold increase in the amount of computing being used for these systems. Over this period, we have noticed not only an incredible growth in the power of these systems but also an enormous increase in the accuracy of these predictions.”
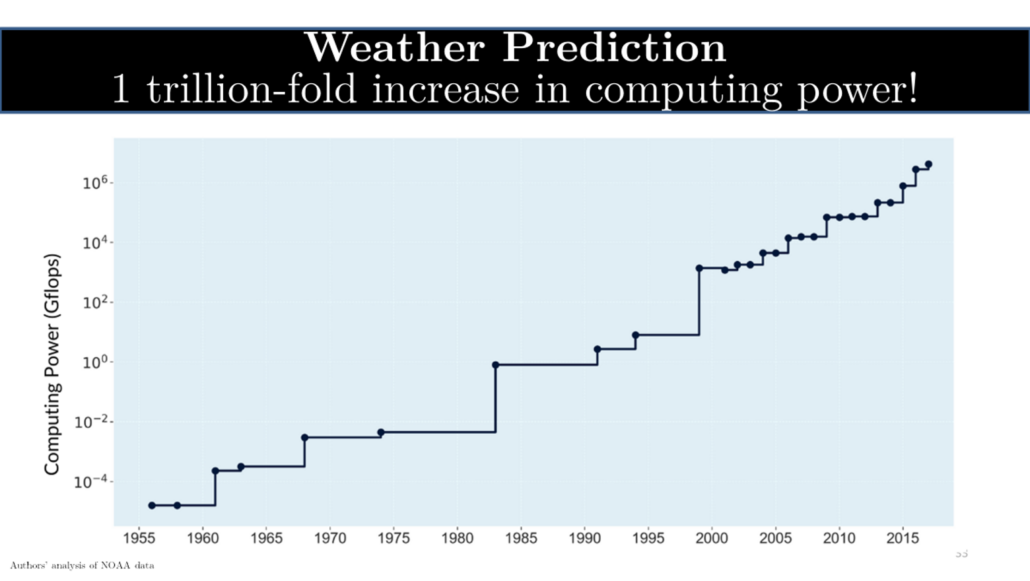
Thompson, N. C., Ge, S., & Manso, G. F. (2022, June 28). The importance of (exponentially more) computing power. arXiv.org. https://arxiv.org/abs/2206.14007
The graph below displays the error rate of these predictions in degrees Fahrenheit over an increase in computing power over the same time scale (1955 – 2019). “We see an incredibly strong correlation between the amount of computing power and how accurate the prediction is”, explained Dr. Thompson. “For example, for predictions three days out, 94% of the variance in prediction quality is explained by the increases in computing power.”
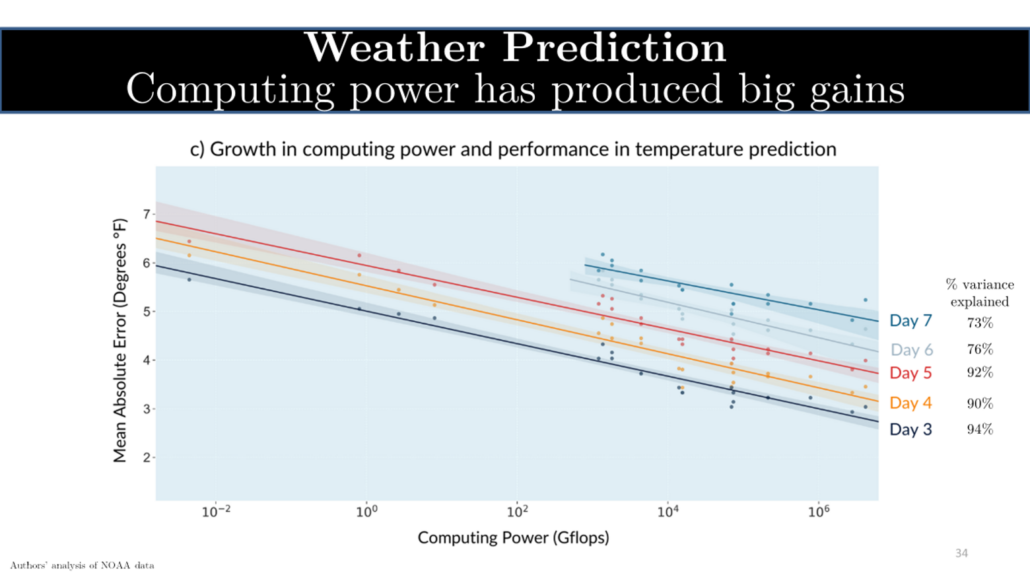
Thompson, N. C., Ge, S., & Manso, G. F. (2022, June 28). The importance of (exponentially more) computing power. arXiv.org. https://arxiv.org/abs/2206.14007
Researchers are not just using more computing power; the availability of increased computing power allows scientists to develop better algorithms that, consequently, can harness this power more efficiently and get more out of these powerful models. For the past 40 to 50 years, we have been able to rely on more computing power because Moore’s Law had not yet reached its limits, and computing power has continued to grow on a regular basis without significant increases in cost. However, with Moore’s Law coming to an end, scientists could no longer rely on regular increases in computing power with low associated costs as they did before. The graph below shows this trend slowing. The Y axis on the graph shows the relative performance compared to a system in 1985, and each dot represents a single computing system. The green dots show how fast these computers run in terms of the clock frequency. “We saw exponential improvements for decades until it plateaued in 2005 at the end of Dennard scaling when chips could no longer run faster. Scientists began to use other methods to increase performance, such as using multi-core processors”, said Dr. Thompson. The black dots show this shift, during which time researchers continued to see exponential improvements. Serialized computing, as shown in the gray line, is unable to take advantage of parallel computing, and we can see that progress slowed way down after 2005. “With increased parallelism, we hope to continue leveraging the growing computing power that we are used to, a trend that also accounts for the increasing production of more specialized chips”, explained Dr. Thompson.

Dr. Thompson then turned the audience’s attention to deep learning. “When it comes to costs, what is going on in deep learning looks very different from other kinds of science. The figure below displays the share of research costs for different research projects that are spent on capital, such as the hardware and equipment necessary to conduct these kinds of research. In most areas of research, the amount of money allocated towards capital is constrained to 20% or less. However, the research being done in artificial intelligence usually requires about a third of the budget to be spent on capital.”

Given that AI research is very expensive and capital-intensive, we can see very different performances in different tasks. Predicting protein folding, for example, has seen incredible progress since we began using AI to predict these patterns. The graph below displays different research groups who are studying protein folding using AI. “Alphafold 1 and 2, developed by DeepMind, have achieved remarkable success and are positioned prominently on this continuum. Their significantly higher accuracy rates are largely attributed to their use of systems that harness computing power on a scale much larger than those employed by the groups to the left. This indicates that access to substantial computing resources will play a crucial role in advancing scientific progress.”

Check out the CCC Blog for a summary of Gabriel Manso’s presentation on The Computational Limits of Deep Learning.


