CRA Update: Taulbee Survey Shows Record Number of Graduates and Strong Enrollment at All Degree Levels
By Matt Hazenbush, Director of Communications, and the CRA Taulbee Survey Team
The Computing Research Association (CRA) is pleased to present the findings of the 53rd annual CRA Taulbee Survey. A widely known and trusted resource in the computing research community, this year’s survey report documents trends in student enrollment, degree production, employment of graduates, and faculty salaries in academic units in the United States and Canada that grant PhDs in computer science (CS), computer engineering (CE), or information (I).
The results of this year’s survey indicate continued strong productivity among doctoral-granting departments. The number of graduates at each degree level was at an all-time high in 2022-23 and, for the most part, overall enrollment in the programs showed increases.
Among U.S. CS institutions, average bachelor’s enrollment in the departments has now been increasing for 16 consecutive years. The departments continue to hire many new teaching faculty to help keep pace with the enrollment growth, though tenure track faculty size also increased somewhat.
Trends in Computer Science, Computing Engineering, and Information Departments
Doctoral Programs
- This year’s respondents reported another all-time high doctoral degree production, breaking the 2021-22 record by 3.2 percent. Among all departments reporting both this year and last year, the number of total doctoral degrees increased by 0.8 percent.
- Among 2022-23 PhD recipients aggregated across CS, CE and I, 24.1 percent identified as female, up from 22.9 percent in 2021-22. Among CS programs that reported doctoral degrees by race/ethnicity, the distribution is similar to that reported for 2021-22.
- Total doctoral enrollment increased this year by 4.7 percent across all responding departments, and increased 3.0 percent among departments reporting both this year and last year.
- The share of females among enrolled doctoral students of known gender rose for the eighth straight year, from 26.1 percent to 26.3 percent across the three areas of CS, CE and I combined. Among those students whose race/ethnicity is known, the overall percentage of doctoral students who were neither Non-resident Aliens, Asian, nor White was 5.6 percent; this is little changed from the 5.7 percent reported last year.
- Among the new 2022-23 PhDs for whom employment information was known, the percentage who took positions in North American industry in 2023-24 was 57.5 percent, down from the near record 62.5 percent reported last year for the new 2021-22 PhDs. Conversely, the percentage who took North American academic jobs was 30.6, considerably higher than last year’s reported record low of 25.8 percent.
- Artificial intelligence/machine learning continues to be by far the most popular area of specialty of new PhDs, comprising more than a quarter of all doctoral degrees awarded for which the area was known.
Master’s Programs
- Overall master’s degree production ballooned in 2022-23, a natural result of the two consecutive years of post-COVID large increases in total master’s enrollment reported in the previous two Taulbee surveys. Both the total number of master’s degrees produced and the average per reporting department are more than double those from last year’s report and are the largest reported master’s production levels in the history of the Taulbee Survey.
- The proportion of female graduates among CS master’s degree recipients increased slightly, from 26.3 percent in 2021-22 to 26.8 percent in 2022-23. Among graduates whose residency and ethnicity is known, the proportion of CS master’s degrees that went to Non-resident Aliens recovered 10 percentage points from last year’s 15 percentage point drop, and is again at the 60 percent level.
- The record production of master’s graduates is not expected to continue this year. The total number of new students in 2023-24 is much less than the number of graduates in 2022-23, while overall enrollment for 2022-23 reported by this year’s master’s programs is similar to that reported in 2021-22 by last year’s master’s programs (this year’s reported enrollment is 0.6 percent less than last year’s).
Bachelor’s Programs
- Bachelor’s degree production continued its post-COVID period rebound in 2022-23 with a second consecutive year of double-digit increase. Aggregated across all three areas, production was up by 17.6 percent. When considering only those departments that reported both years, the increase in total degree production across the CS, CE and I areas was 15.5 percent among all departments.
- Gender diversity among bachelor’s graduates was somewhat higher in 2022-23 than in 2021-22. Among graduates whose gender was reported, 23.3 percent were female in aggregate across all disciplines compared with 22.7 percent in 2021-22. The percentage of bachelor’s graduates who are White decreased across CS, CE, and I.
- In aggregate across all three areas, U.S. CS departments reported an increase in new majors per department of 3.4 percent. When only departments reporting both this year and last year are considered, the count of new majors increased by 7.3 percent across all departments, and 9.5 percent at U.S. CS departments. This is the third consecutive year of such increases.
Long-Time Taulbee Team’s Swan Song
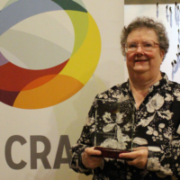
This year marks the final collaboration of the CRA Taulbee Survey’s long-time partners Betsy Bizot, CRA Senior Research Associate, and Stuart Zweben, Professor Emeritus at The Ohio State University.
Bizot – who was honored with the 2021 Distinguished Alumni Award from the Virginia Tech Department of Computer Science – is retiring from CRA after many years of service to CRA and the CRA Taulbee Survey.

About the Survey
Conducted each fall since 1974, the survey name honors Orrin E. Taulbee of the University of Pittsburgh, who conducted these surveys for the Computer Science Board until 1984, with retrospective annual data going back to 1970. In its current form, the survey documents trends in student enrollment, degree production, employment of graduates, and faculty salaries in academic units in the United States and Canada that grant PhDs in computer science (CS), computer engineering (CE), or information (I).
In 2020, the CRA Taulbee Survey was honored with the Service to CRA Award in recognition of 50 years of providing an invaluable resource to CRA as well as to the computing community.
The survey generally covers the preceding academic year, with the notably exception of faculty salary data, which are for the current year. CRA gathers survey data during the Fall. For this year, responses received by February 14, 2024 are included in the analysis. CRA surveyed a total of 314 PhD-granting departments and received responses from 176, for an overall response rate of 56 percent.