Heads Up: Taulbee Survey to Receive a New Look
In the May issue of CRN, we expect to publish this year’s full Taulbee report. Beginning this year, we no longer will stratify the U.S. computer science department data based on National Research Council rankings. Instead, stratification dimensions will include whether the institution is public or private, tenure-track faculty size of the reporting department, and the population of the locale in which the institution is located. This will allow our readers to get multiple views of important data, and hopefully gain new insights from them. These dimensions were recommended by the CRA Surveys Committee, and approved by the CRA Board of Directors, following extensive discussion of various options.
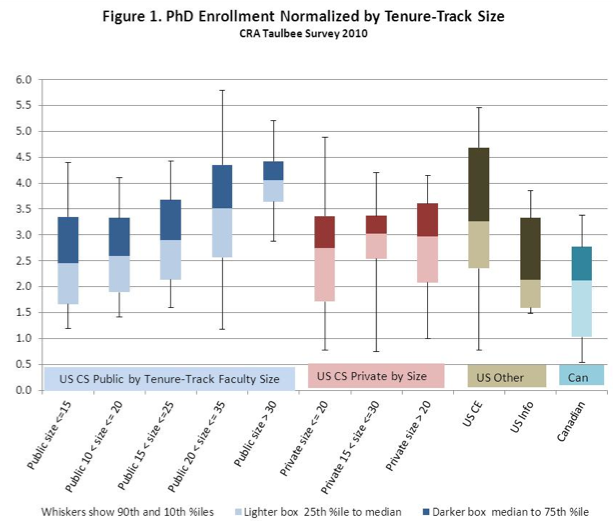
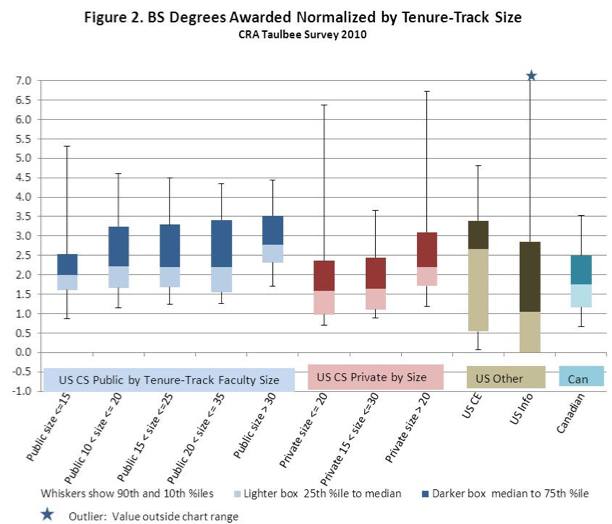
Tables that used to report U.S. CS data by NRC rank generally will report data stratified by public vs. private. Salary data also will be stratified using the other dimensions and will be reported via “box and whiskers” diagrams that show medians, quartiles, and the range between the 10th and 90th percentile (see insert for a description of these diagrams). Degree, enrollment and research expenditure data will be normalized and stratified by size of tenure-track faculty, and also will be presented using box and whiskers diagrams.
To illustrate the idea, and to give you some basis for comparing this year’s report to data from last year, we reproduce a few selected data below using these new methods. At this year’s Snowbird Conference, we will have an opportunity to get feedback from you about the new reporting, so that we may best provide what you need and continue improving the value of the survey to you, our constituents.
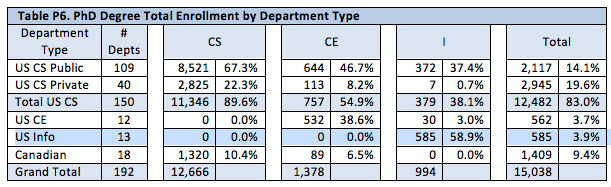
Example 1: Ph.D total enrollment. Table P6 and Figure 1 show the Ph.D. enrollment data for fall 2010. The table is an update of Table 6 of the 2010 Taulbee Survey report, with entries showing the total doctoral enrollment for each department type. The diagram is new and provides more detailed distributional information by department type; U.S. CS departments are further stratified based on tenure-track faculty size. These faculty size strata overlap so that a department generally falls into more than one stratum, allowing a wider base of comparison particularly for those departments that fall near the boundary of a given stratum. To produce the distributions illustrated in the diagram, the doctoral enrollment data provided by a department was first normalized by the number of tenure-track faculty in that department.
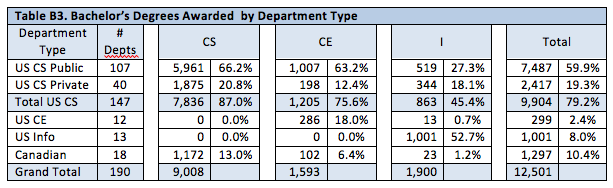
Example 2: Bachelor’s degree recipients. Table B3 and Figure 2 show the bachelor’s degree recipient data for 2009-10. The table is an update of Table 11a of the 2010 Taulbee Survey report, showing total bachelor’s degrees granted for each department type; the box and whiskers diagram follows the same approach as described in example 1, using the bachelor’s degree recipient data reported by the various departments.
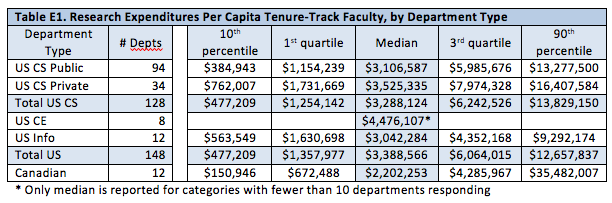
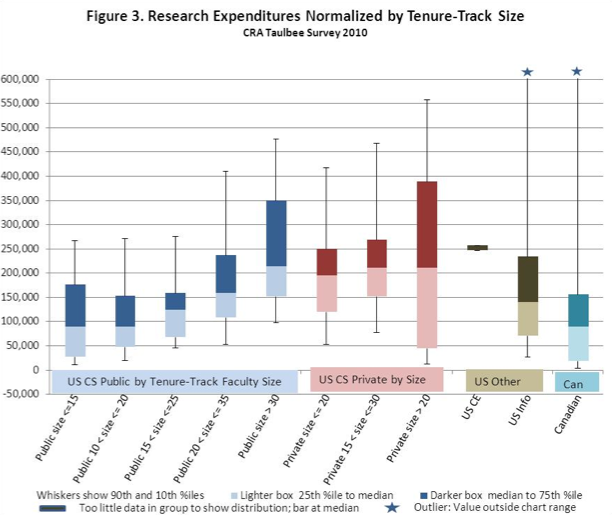
Example 3. Research expenditures. Table E1 shows the research expenditure data by department type. This is an update of Table 24-1 of the 2010 Taulbee Survey report. The box and whiskers diagram in Figure 3 shows the distribution of 2009-10 research expenditures per tenure-track faculty, using the stratification method of the previous examples. The data for this diagram originally were reported in Table 24-2 of the 2010 Taulbee Survey.
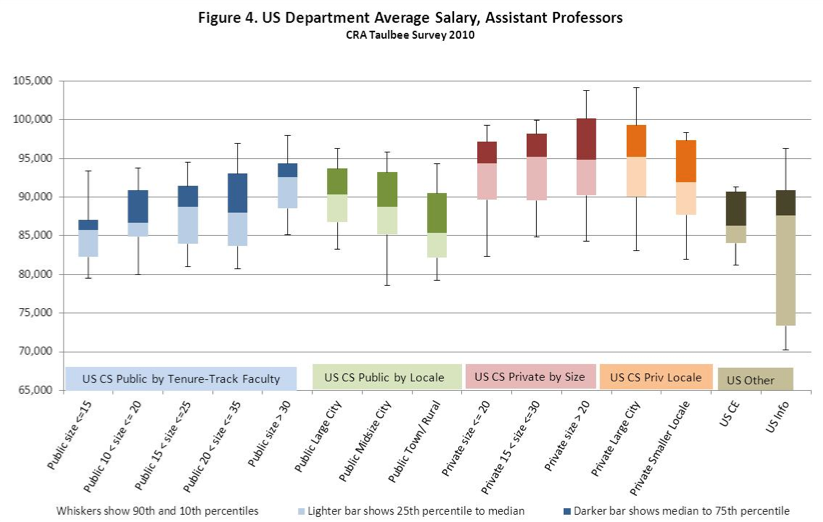
Example 4. Assistant Professor salaries. The box and whiskers diagram in Figure 4 shows the salary distribution for assistant professors as of January 2010, based on data reported in the 2010 Taulbee Survey report. The data used here are the assistant professor average salaries reported by the various departments in that survey. So a box and whiskers shows the 10th, 25th, 50th, 75th and 90 th percentiles of the average assistant professor salaries for departments falling into the particular stratum. This means they are not true percentiles of the individual assistant professor salaries (the true percentiles of the individual salary data were provided to those departments that provided individual data). Two sets of strata are used for U.S. CS salary data-one is based on tenure-track faculty size, as above, while the other is based on the population of the geographic locale in which the department’s institution is located. Both are illustrated in the diagram. In this stratification, “large city” is one whose metropolitan area population is at least 250,000. “Midsize city” is one whose metropolitan area population falls between 100,000 and 250,000.
Observations
Though variances can be large, it appears that, per tenure-track faculty member, the larger departments at public universities had higher Ph.D. enrollment, produced more bachelor’s degrees, and had greater research expenditures than did smaller public departments. Private exhibit these tendencies to a lesser degree, particularly with respect to research expenditures. However, there are a smaller number of strata for comparison in the cluster of private institutions.
Assistant professor salaries at private institutions tended to be higher than those at public institutions regardless of the size of the department. However, at each type of institution, larger departments tended to have higher salaries, and departments located in larger locales tended to have higher salaries.
We hope you will find the new presentations useful.
Stuart Zweben, Ohio State University (Emeritus) is Chair of CRA’s Surveys Committee.
Betsy Bizot is Director of Statistics and Evaluation at CRA.