Counting Computing: CRA Taulbee Survey and NSF Statistics
When people in the computing field talk about numbers in computing – numbers of degrees granted, students enrolled, faculty, dollars in salary or research expenditures – they often refer to the annual CRA Taulbee Survey. But Taulbee is not the only source of information on computing. How do Taulbee results compare to some of the other available information?
Taulbee Data
CRA is proud of the Taulbee survey, which has been conducted for more than 40 years and is currently sent to more than 260 PhD-granting academic units (departments and schools or colleges of computing) of computer science, computer engineering, and information in North America. It collects information about students, faculty, salaries, and research expenditures. Taulbee is an excellent source of information for many purposes and the only real source of information for some purposes. Even for information covered in other ways, Taulbee results are generally available 9 months or more earlier and so provide a leading indicator of more comprehensive results. However, Taulbee has its limitations, particularly when discussing bachelor’s degrees, because Taulbee surveys only PhD-granting departments and many bachelor’s degrees in computing are granted by non-PhD departments.
NSF Data
NSF’s numbers are compiled by the National Center for Science and Engineering Statistics from multiple sources. NCSES has a wealth of information at http://www.nsf.gov/statistics/ Their results cover all disciplines of science, mathematics, and engineering. In addition to reports and associated standard data tables, NCSES also offers the WebCASPAR database at https://webcaspar.nsf.gov/ which can be used to create custom data tables.
The comparisons in this article use data from two national sources. The Integrated Postsecondary Education Data System (IPEDS) is managed by the National Center for Education Statistics for the Department of Education; it gathers comprehensive information from all US postsecondary institutions. The Survey of Earned Doctorates (SED) is completed by individuals, not institutions; it is sent annually by NSF to all individuals completing doctorates in the United States. SED results broken out by detailed field include the category of “computer sciences,” which encompasses computer science, information science, and some specialized areas such as artificial intelligence and computer graphics.
How well do Taulbee and NSF numbers agree?
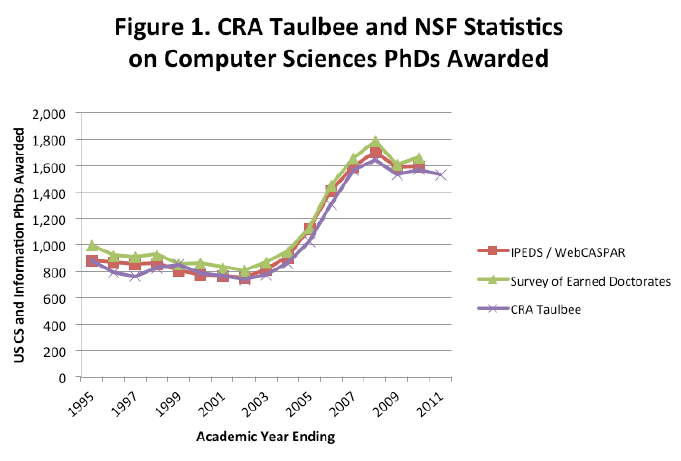
Figure 1 compares Taulbee, IPEDS, and SED numbers of PhDs granted. As expected, the three sources track quite closely. The numbers reflect “computer science” from IPEDS, “computer sciences” from SED, and the degrees granted by US Computer Science and US Information programs from Taulbee (which may include some computer engineering degrees granted by combined Computer Science and Engineering or Electrical Engineering and Computer Science departments). Note that in 2008, Taulbee began including information PhDs as well as computer science and computer engineering; before that, information programs and degrees were not included.
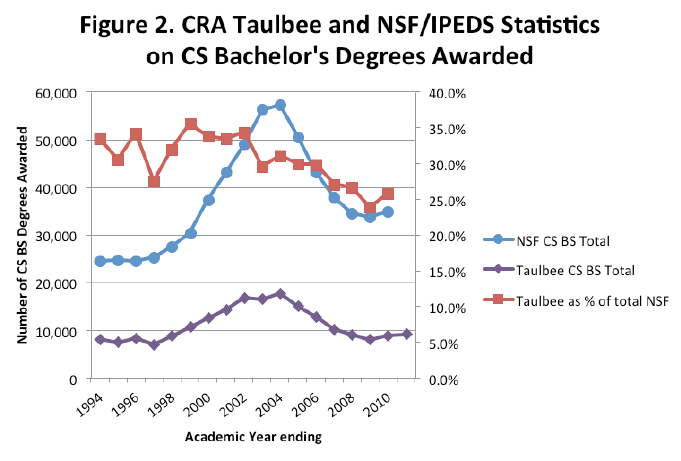
Figure 2 compares Taulbee and IPEDS for bachelor’s degrees granted. In addition, on the right-hand axis, it shows the percent of total US CS bachelor’s degrees accounted for by Taulbee. During 1994 to 2010, Taulbee included only a quarter to a third of total bachelor’s degrees. However, Taulbee parallels the more comprehensive IPEDS numbers in general trends (peak in 2004, valley in 2009, turnaround beginning in 2010).
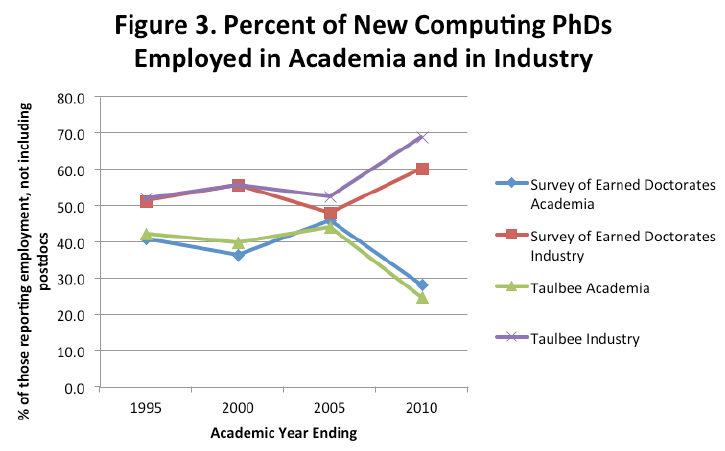
Figure 3 compares Taulbee and SED on the percentage of new PhDs taking employment in industry vs. academia. The Taulbee numbers in this figure represent the same total number of employed PhDs as in the annual Taulbee reports, but the percentages are calculated differently in two ways to be comparable to results available from the SED. First, postdoctorates are not counted as employed (SED counts them as continuing study), and second, the percentages of new PhDs going to industry and to academia are out of those reporting domestic employment, not out of all PhDs in that year. The Taulbee and SED percentages parallel quite closely; this is a nice check on the accuracy of the employment the departments report to Taulbee compared to employment reported by the new PhDs themselves in the SED. Not shown on the figure, Taulbee reports higher numbers of new PhDs in each employment type because the SED includes only US computer sciences while the Taulbee adds Canadian and US CE PhDs, but the pattern is clearly unaffected by that difference in scope. In 2005 and particularly in 2010, Taulbee reports a slightly higher percentage to industry than does the SED; this may reflect the fact that Taulbee treats postdoctorates as a subcategory of academia and therefore departments may be counting industry postdocs as industry employment.
Why do Taulbee and NSF numbers disagree?
Taulbee generally agrees well with the more comprehensive NSF results. Differences may come from several causes.
- Timing. Although Taulbee and IPEDS cover the same academic year, there may still be some differences in timing between the results departments report to Taulbee and those the institution reports to IPEDS, especially for PhDs.
- Participation.
- Type of institution. This is the main source of difference in the bachelor’s degree numbers. Taulbee goes to only the PhD-granting institutions; IPEDS includes all institutions – public and private master’s-granting and baccalaureate schools and for-profit schools. Although the PhD-granting departments included in Taulbee tend to be larger, granting more bachelor’s degrees per department, there are many more of the non-PhD departments.
- Number of institutions. Taulbee has a high rate of response, but IPEDS is mandatory for institutions that participate in any form of federal financial aid, and therefore has nearly universal response.
- Location of institutions. Taulbee collects data on both US and Canadian institutions. To the extent possible, results here are for US students only, but the Taulbee employment numbers in particular are difficult to disaggregate.
- Boundaries of the discipline.
- The Taulbee survey collects data on computer engineering as well as computer science and, since 2008, on information programs and degrees. The numbers reported from Taulbee for bachelor’s degrees do not include degrees from standalone computer engineering or information academic units, but they do include degrees from units such as “computer and information sciences” and “computer science and engineering,” some of which may not be in the field of computer science as tabulated by IPEDS. The Taulbee numbers for PhDs do not include standalone computer engineering programs, but do include information programs; they still may not match the “computer sciences” categorization in the SED. In addition, the Taulbee numbers on employment of PhDs do not distinguish between CS, CE, and Information students nor between US and Canadian students.
- The rise in interdisciplinary programs, while beneficial in many ways, makes life complicated for statisticians. Degrees in disciplines such as bioinformatics and digital media may be reported as CS or not, and that may change if a specialization area spins off to a separate degree. Furthermore, some institutions get their numbers for Taulbee from their institutional research group, and so will provide the same information to Taulbee as is provided to IPEDS, but others get their Taulbee numbers from departmental records and so an institution may categorize students differently for Taulbee than for IPEDS.
Conclusion
The CRA Taulbee Survey differs in scope and intent from federal efforts such as IPEDS and the Survey of Earned Doctorates. Because of its focus on a single field and the participation of a relatively small number of departments, Taulbee results can be made publicly available as much as a year before comprehensive results through NSF. These comparisons of PhD degrees, bachelor’s degrees, and PhD employment suggest that Taulbee is a reliable leading indicator for PhD information. For bachelor’s degrees, Taulbee results generally mirror the trends of the field as a whole, but include well under half of the degrees. We know from other sources that the PhD-granting departments are statistically different from the non-PhD departments in, for example, the number of women and underrepresented minorities who receive bachelor’s degrees (significantly higher in the non-PhD departments). Therefore, Taulbee PhD results provide a reliable picture of the state of the field, while Taulbee bachelor’s results are useful but should be interpreted with caution.
Acknowledgements
Thanks to Mark Fiegener, SED Project Officer, Human Resources Statistics Program, NSF, who provided the SED data that was used in Figure 3. Thanks also to Stu Zweben, CRA Survey Committee Chair, who provided valuable feedback on an earlier draft of this article.


