2013 Taulbee Report Sneak Preview
The 2013 Taulbee Report will be published in the May 2014 issue of CRN. However, as we did last year, we’re offering you a preview of the degree and enrollment numbers for bachelor’s and doctoral level programs in the departments responding to the survey.
For the second year in a row, the total number of Ph.D.s awarded was the highest ever reported in Taulbee. The departments that responded this year reported 1,991 graduates in 2012-13, surpassing the 1,929 reported for 2011-12 by last year’s respondents.
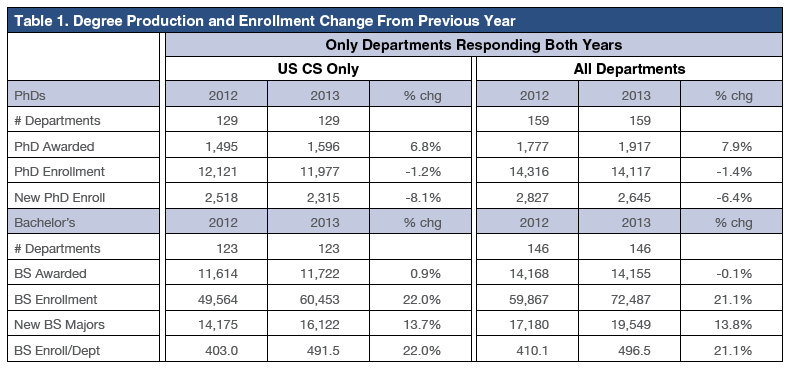
Since the specific departments reporting from one year to the next vary, it is of interest to focus on the set of departments who reported in both years. The accompanying table shows the one year comparison of some key bachelor’s and doctoral data for these departments.
Again this year, the enrollment data show very strong growth at the bachelor’s level, with a 22 percent increase in bachelor’s enrollment during 2012-13 as compared with 2011-12 in U.S. CS departments. The corresponding increase for all departments reporting both years is 21.1 percent. New bachelor’s students in fall 2013 are up 13.7 percent over the previous year in U.S. CS departments, and are up 13.8 percent among all departments, while the number of bachelor’s graduates increased only 0.9 percent among U.S. CS departments and was basically unchanged (down 0.1 percent) among all departments reporting both years.
At the doctoral level, the situation is different. Overall reported Ph.D. production for 2012-13 among U.S. CS departments reporting both years rose 6.8 percent, and rose 7.9 percent among all departments reporting both years. However, total doctoral enrollment is slightly down, with a 1.2 percent decrease among U.S. CS departments and a 1.4 percent decrease among all departments reporting both years. The number of new doctoral students for fall 2013 fell 8.1 percent among U.S. CS departments and 6.4 percent among all departments, when compared with the fall 2012 figures.
Watch the May 2014 CRN for a more complete analysis of the Taulbee data.


