Baccalaureate Origins of Women Ph.D.s in Computing, 1990-2013
Background
As part of a larger project examining trends in the representation of women in computing from 1990-2013, we licensed data from the National Science Foundation’s Survey of Earned Doctorates (SED). The SED is sent each fall to every individual who received a research doctorate from an accredited U.S. institution in the previous academic year. It asks about the respondent’s educational background, demographics, and postgraduation plans. In 2013, 92 percent of doctoral recipients completed the survey. We included data on SED respondents whose field of doctoral program was in the disciplines of (SED codes are listed in the parenthesis): Computer Science (400), Computer Engineering (321), Information Science & Systems (410), Robotics (415), and Computer & Information Systems, Other (419).
This article looks at trends in the source of the baccalaureate for women who completed doctorates in computing between 1990-2013. Future CRN articles will report on other aspects of the SED data.
We categorized respondents’ baccalaureate institutions into one of five groups. For baccalaureates inside the U.S., we used a 2 x 2 split of public/private and research/non-research; baccalaureate institutions outside the U.S. are categorized as “foreign.” For the U.S. schools, we defined “research” institutions as those in the Carnegie classifications of “Doctoral/Research Universities,” “Research Universities-High Research Activity,” and “Research Universities-Very High Research Activity.” All other institutions were classified as “non-research.”
For baccalaureates from outside the U.S., the country or region of baccalaureate was coded for locations that were the baccalaureate origin of 5 percent or more of Ph.D.s over the entire 1990-2013 period. Those locations were India, China, South Korea, and the Middle East.
Results
Figure 1 shows, of SED respondents whose origin is each type of baccalaureate institution, what percent are female. For-profit institutions are omitted; only 37 doctoral recipients received their baccalaureate degrees from that type of institution over the period 1990-2013. There is substantial fluctuation from year to year; Figure 1 groups data in three-year bins to reduce the fluctuation. There is no clear trend except for the foreign institutions, from which there is a steady increase in the percent of women (alpha = .01 by Spearman rank correlation coefficient, with year and percent of women participation as the two variables whose ranks were being examined). In general, the non-research institutions had a higher percentage of women than the research institutions, and public research institutions had a higher percentage of women than private research institutions.
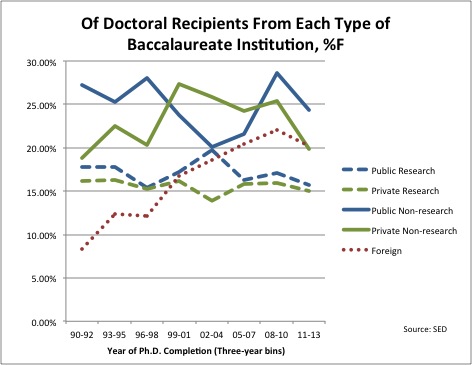
Figure 1. %F of doctoral recipients by type of baccalaureate institution
Figure 2 looks at the same data from a different direction. It asks, Of the women who received a Ph.D. in each year, what fraction came from each type of baccalaureate institution? In this view, the increasing role of foreign institutions as the baccalaureate source for women Ph.D.s is even clearer, dwarfing the differences between types of domestic institutions. Within the domestic institutions, the public research institutions are consistently the largest source of women Ph.D.s. Although women have been a smaller percent of the baccalaureate recipients from these institutions than they have been from non-research institutions, because these departments are larger on average, they produce larger total numbers of women who continue to a Ph.D.
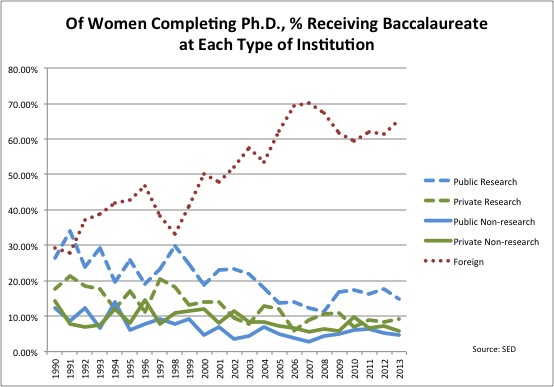
Figure 2. Of women completing Ph.D., % from each type of baccalaureate institution
For comparison, Figure 3 shows the percent of male and female doctoral recipients whose baccalaureate degrees came from foreign institutions. This demonstrates that the increase in women from foreign institutions is not simply proportional to an overall increase in foreign students. The increase in the percent of foreign baccalaureates among Ph.D. recipients has increased significantly for both genders (alpha = .01 for each) but, as the graph illustrates, there has been greater increase in this percentage among women.
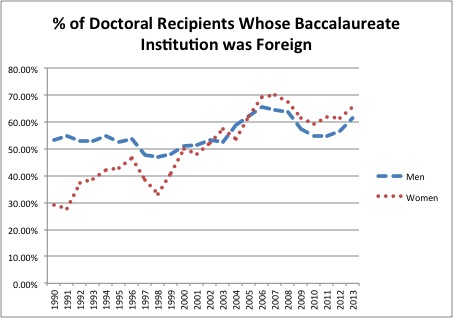
Figure 3. % of doctoral recipients whose baccalaureate was foreign, by gender
Because the growth in foreign students is so strong, we were also interested in the source of these students by country or geographic region. Figure 4 shows, among Ph.D. recipients who earned their baccalaureate in selected geographic areas, the percent who are women. (This does not necessarily reflect the citizenship of the student.) The areas were selected as those with 5 percent or more of the total Ph.D. recipients, male and female, who earned U.S. doctorates in 1990-2013. Because of fluctuation from year to year, the figure shows data grouped into three-year bins.
There are significantly increasing percentages of women from India, the Middle East, and South Korea (alpha =.01 for each). There also is an increasing percentage of women from China (p=.06). Both China and South Korea showed a downturn in percent of women in 2011-2013. From 1990–2013 there was no significant change in the percentage of women among Ph.D. recipients who earned their baccalaureate in the U.S.
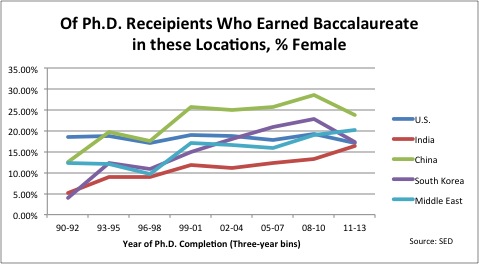
Figure 4. %F of Ph.D.recipients who earned baccalaureate in countries or regions
Conclusions
The high representation of foreign students among U.S. doctoral women is not a surprise. These findings do, however, have implications for those who are interested in the recruitment and retention of women graduate students. First, there is not a single pipeline from undergraduate through doctoral study; therefore, a direct comparison of the percentage of women at the undergraduate level with the percentage of women at the graduate level oversimplifies the issue. This means, among other things, that the recruitment of domestic women undergraduate students is not the only source of women in graduate programs, but is particularly important, because they are even less well represented than the overall statistics suggest. Second, it is a reminder that activities at the institutional or cross-institutional level supporting women in graduate computing need to keep in mind the dual nature of their participants and the fact that their needs may differ.
Acknowledgements
This work was supported by grant B2014-12 from the Alfred P. Sloan Foundation.
Data from the Survey of Earned Doctorates was licensed through the National Center for Science and Engineering Statistics at the National Science Foundation. The use of NSF data does not imply NSF endorsement of the research methods or conclusions contained in this report.