Education Funding for First-Generation Versus Continuing-Generation Undergraduate Students
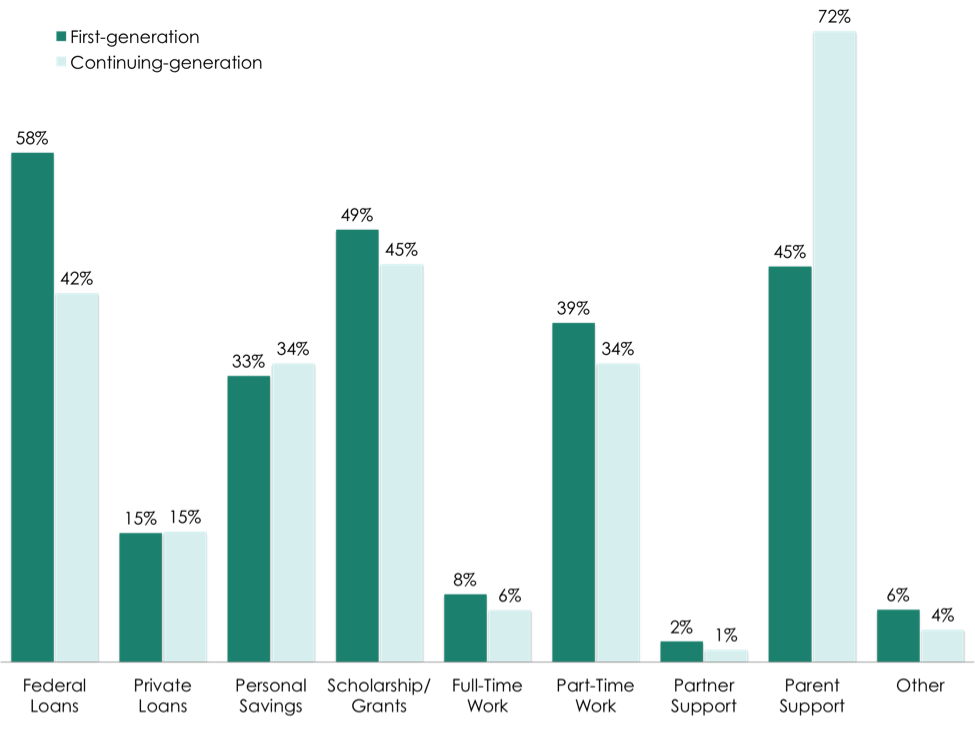
In CERP’s annual survey of undergraduate students in computing fields, students were asked to identify the resources they are using to fund their education. They could select multiple resources. The graphic above shows the distribution of responses for first-generation versus continuing-generation college students. The percentages are the number of students who selected a particular funding source out of the number of students within each group (total first-generation students = 1,076; continuing-generation students = 7,157). While first-generation students’ most frequent source of education funding comes from federal loans, continuing-generation students rely most frequently on financial support from their parents. The data also show that first-generation and continuing-generation students take out private loans, make use of their personal savings, receive scholarships and/or grants, work part- or full-time, and are supported by their spouse or partner at similar rates.
Notes. This analysis examines survey data collected in fall 2015 from a sample of undergraduate students in computing programs in the U.S. A total of 9,721 undergraduate students responded to this survey. Of these, 8,233 provided information on their first-generation college student status and education funding resources. Generation status was coded as follows: students were asked to report up to two parents’ highest education level, including: Less than high school; High school graduate or GED; Some college; Bachelor’s degree; Master’s degree; PhD; and professional degree. Students whose parents’ education level was either (a) less than high school or (b) high school graduate or GED were coded as first-generation college students. All other students were coded as continuing-generation students. If students listed education levels for two parents, we applied our coding system to the parent who had the highest education level.
![]()
This info-graphic is brought to you by the CRA’s Center for Evaluating the Research Pipeline (CERP). CERP provides social science research and comparative evaluation for the computing community. To learn more about CERP, visit our website at https://cra.org/cerp/.
This material is based upon work supported by the National Science Foundation under Grant Number (CNS-1246649; and/ or DUE-1431112). Any opinions, findings, and conclusions or recommendations expressed in this material are those of the author(s) and do not necessarily reflect the views of the National Science Foundation.