
The 2016 Taulbee Survey: Supplementary Report on Course-level Enrollment
The 2016 Taulbee Survey report, published in the May 2017 issue of CRN, did not include the results of a component that was introduced in the most recent survey–namely, bachelor’s enrollment data from specific courses in the curriculum. This component was introduced as a result of what was learned in the CRA Enrollment Report (see https://cra.org/data/generation-cs). Unfortunately, we were unable to compile the data in time to feature the results in the May issue.
We asked departments to provide fall 2016 enrollment data for four representative courses in their undergraduate computer science program: an introductory course for non-majors, an introductory course for majors, a mid-level course, and an upper-level course. For each course, we also asked respondents to delineate the number of CS majors, the number of women, and the number of persons from underrepresented minorities (URMs) in the course. More than ninety departments provided us with fall 2016 data. Of these departments, between 71 and 74, depending on the level of the course, also provided data for fall 2015 to the CRA Enrollment Survey. Most, but not all, used the identical courses in 2015 and 2016. In this article, we will confine our analysis to the 65-68 departments that provided data for the same courses in both years as this gives us the best “apples to apples” comparison.
Year-to-year change can be calculated in several ways. The most straightforward is to look at the percent change in the total between year 1 and year 2 for all academic units that reported both years. Table 1 takes this approach; it shows the number of departments reporting each category of data, the totals in each category for those departments in 2015 and 2016, and the percent change of the total from 2015 to 2016. The change in the totals is the community-wide change (of all reporting units), and is the way we look at changes in enrollments and degrees in the annual Taulbee report. However, large changes in a few departments will have a disproportionate effect on the overall change. To mitigate this effect, particularly with respect to changes in enrollment among demographics (the percent of students who are majors, women, or underrepresented minorities) for which we have fewer data points, we also look at the medians of the unit-level values in each year. Unit medians are reported in Table 2 and shown in Figure 1. These median differences are elaborated upon in the next three sections.
Overall Enrollment Results
The data indicates that median enrollment in both the mid-level and upper-level courses increased by double-digit percentages from 2015 to 2016 (13.2 percent for mid-level and 18.0 percent for upper-level). With this raw growth, the percentage of students in these courses who were CS majors remained relatively constant (65.8 percent in 2015 and 66.3 percent in 2016 for the mid-level course, and 82.0 percent in 2015 and 82.4 percent in the upper-level course). Thus, the number of majors in these courses rose considerably, even though the fraction of majors in the courses did not. In fact, the overall average one-year growth per U.S. CS department in total CS majors, as reported in the May 2016 Taulbee Survey report, was 24.8 percent. That average includes many more departments than are represented in the course-level data, and also includes some departments that reported in only one of the two years. The data therefore suggests that we will continue to see double-digit percent increases in the number of CS degrees produced at the bachelor’s level for at least the next couple of years.
Since there is a fairly constant fraction of majors in these courses, there also is a fairly constant fraction of non-majors, suggesting that there is continued strong growth in the enrollment by non-majors in courses beyond the introductory level. Table 1 shows the overall growth in non-majors enrollment was 35.7 percent in the mid-level course and 8.5 percent in the upper-level course. As noted in the CRA Enrollment Report, strong interest by non-majors is an important component of the current enrollment surge, and needs to be accounted for in departments’ overall responses to the surge.
In the introductory level course for majors, the one-year change looks quite different from that in the higher-level courses. There is only a 1.1 percent increase over 2015 in the median enrollment in the introductory course for majors. The median percentage of students who are majors in this course declined slightly (from 43.5 percent in 2015 to 41.9 percent in 2016). Is this a sign that the tremendous decade-long CS enrollment growth we’ve experienced may be abating? The 2016 Taulbee Survey report noted a whopping 19.9 percent increase per department in new CS majors at U.S. CS departments in one year. However, once again this data includes departments that reported in only one of the two years. In the subset of 48 departments that not only provided enrollment data in 2015 and 2016 for the introductory course for majors, but also provided it to the CRA Enrollment Survey for 2005 and 2010, the median enrollment change from 2015 to 2016 was 3.1 percent. Further, as shown in Table 1, the total enrollment growth in this course was 6.9 percent among the 67 departments that provided total enrollment data. It also should be noted that percent of students who are CS majors in the introductory course for majors is less precise than we would like, because it depends in part on when the institution allows students to declare a major. This often occurs after the introductory course has been successfully completed. Thus, we feel it is premature to jump to conclusions about the predictive nature of the 1.1 percent median enrollment increase in the introductory course for majors, although it does bear watching.
The introductory course for non-majors experienced a median growth of 4.4 percent from 2015 to 2016 in total enrollment. This is yet another indication that interest in CS courses continues to be high.
Diversity Results
Except in the introductory course for non-majors, the median percentage of women in courses at each level was either fairly constant or increasing. The most notable increase was in the mid-level course, where the median percentage of women went from 17.4 in 2015 to 20.0 in 2016. The median percentage of women in the upper-level course also increased, from 14.1 to 15.9 percent. We see a slight drop-off from the median percentage of women in the introductory course for majors in 2015 (21.0 percent) to the median percentage of women in the mid-level course in 2016 (20.0 percent), and a somewhat larger drop-off between the median percentage of women in the mid-level course in 2015 (17.4 percent) and the median percentage of women in the upper-level course in 2016 (15.9 percent). Because the median percentage at each level is for a single representative course, not for all students at that level, some of the differences between levels may be attributable to the specific courses on which the institutions chose to report. Overall, however, this trend of decreasing representation of women at higher course levels is congruent with other data.
It will be interesting to see how predictive the median upper-level enrollment percentage of women is of the overall percentage of 2016-17 CS bachelor’s graduates who are women. Next year’s Taulbee Survey will report this number. This year’s percentage was 17.9. However, the percentage of women reported in the upper-level course includes both CS majors and non-majors, while the reported graduates in the Taulbee Survey are just CS majors. So the expected predictability of the upper-level enrollment by women on the fraction of CS major graduates who are women is unclear. Also note that only approximately 60 percent of the departments that provided overall course enrollment data also provided course-level data about gender.
The data for underrepresented minorities also includes both majors and non-majors, and excludes departments from minority-serving institutions (MSIs); while MSIs educate significant numbers of URM students, as shown in Table 1, they are not comparable to non-MSIs when the metric is the percent of students who are URMs. The introductory course for majors shows a one-year gain, from 12.9 percent to 15.1 percent, in the median percentage of students who are from underrepresented ethnic groups. The mid-level and upper-level data in the two years show slight increases (10.7 to 11.2 and 8.7 to 8.9, respectively). As was the case for gender diversity, there is a drop-off in median ethnic diversity from the introductory course for majors in 2015 (12.9 percent) to the mid-level course in 2016 (11.2 percent) and from the mid-level course in 2015 (10.7 percent) to the upper-level course in 2016 (8.9 percent). Median enrollment from underrepresented ethnic minority groups also fell somewhat in the introductory course for non-majors (13.8 percent to 12.6 percent).
Final Remarks
We intend to continue requesting course-level enrollment data in the Taulbee Survey, which can help us spot changes in enrollment patterns at a more fine-grained level than was previously possible. We also intend to report the results of the data thus collected as part of the full report that is published in CRN in May 2018. We are thankful to all who provided data this year, and hope that more will do so in the coming year. We also are grateful to Tracy Camp, who provided helpful comments and suggestions about an earlier version of this article.
| Total Students | Majors | Non-majors | Women | URMs from MSIs | URMs from non-MSIs | |
| Intro Non-majors | ||||||
| Intro Non-majors 2015 | 19393 | 932 | 8646 | 3445 | 57 | 946 |
| Intro Non-majors 2016 | 20211 | 975 | 9139 | 3360 | 51 | 1091 |
| # Departments | 66 | 32 | 32 | 39 | 2 | 27 |
| % Change | 4.2% | 4.6% | 5.7% | -2.5% | -10.5% | 15.3% |
| Intro Majors | ||||||
| Intro Majors 2015 | 23180 | 6291 | 9409 | 2916 | 528 | 1117 |
| Intro Majors 2016 | 24788 | 6210 | 10879 | 3317 | 517 | 1438 |
| # Departments | 67 | 48 | 48 | 40 | 3 | 26 |
| % Change | 6.9% | -1.3% | 15.6% | 13.8% | -2.1% | 28.7% |
| Mid-level | ||||||
| Mid-level 2015 | 12211 | 5250 | 3728 | 1480 | 253 | 568 |
| Mid-level 2016 | 14684 | 5838 | 5059 | 1761 | 316 | 738 |
| # Departments | 68 | 50 | 50 | 39 | 2 | 26 |
| % Change | 20.3% | 11.2% | 35.7% | 19.0% | 24.9% | 29.9% |
| Upper-level | ||||||
| Upper-level 2015 | 8413 | 4069 | 1980 | 933 | 106 | 309 |
| Upper-level 2016 | 9203 | 4589 | 2149 | 957 | 108 | 374 |
| # Departments | 65 | 48 | 48 | 36 | 1 | 22 |
| % Change | 9.4% | 12.8% | 8.5% | 2.6% | 1.9% | 21.0% |
Table 1. Numbers of students enrolled in representative courses, overall and by subgroup.
| Total Students | % Majors | % Women | % URMs in non-MSIs | |
| Intro Non-majors 2015 | 180 | 2.7 | 36.7 | 13.8 |
| Intro Non-majors 2016 | 188 | 3.0 | 34.4 | 12.6 |
| # Departments | 66 | 50 | 39 | 29 |
| % Change | 4.4% | |||
| Intro Majors 2015 | 280 | 43.5 | 21.0 | 12.9 |
| Intro Majors 2016 | 283 | 41.9 | 21.8 | 15.1 |
| # Departments | 67 | 49 | 40 | 28 |
| % Change | 1.1% | |||
| Mid-level 2015 | 144 | 65.8 | 17.4 | 10.7 |
| Mid-level 2016 | 163 | 66.3 | 20.0 | 11.2 |
| # Departments | 68 | 50 | 39 | 28 |
| % Change | 13.2% | |||
| Upper-level 2015 | 100 | 82.0 | 14.1 | 8.7 |
| Upper-level 2016 | 118 | 82.4 | 15.9 | 8.9 |
| # Departments | 65 | 48 | 37 | 27 |
| % Change | 18.0% | |||
Table 2. Academic-unit medians of students enrolled in representative courses, and of percent by subgroup.
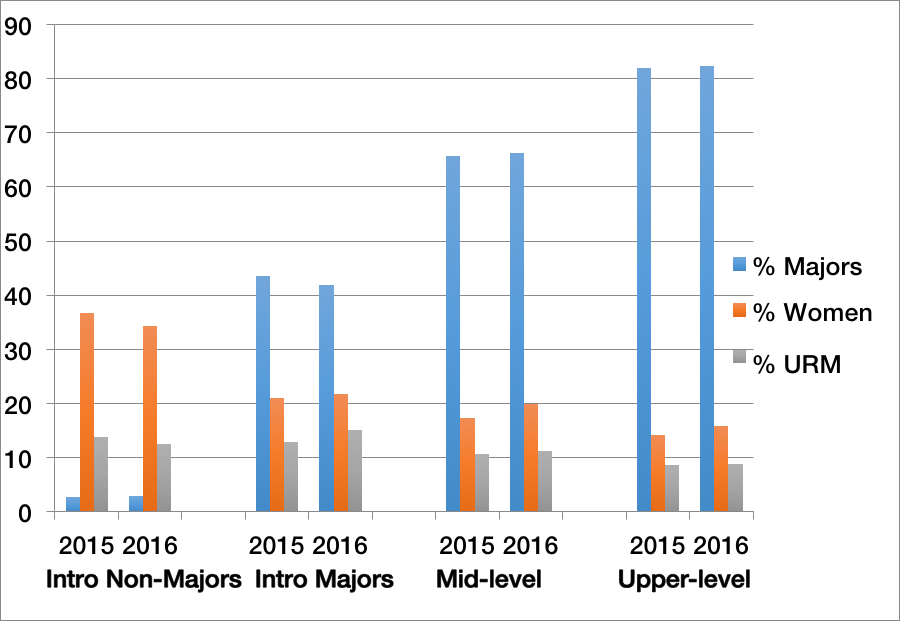
Figure 1. Median percent of students enrolled in a representative course at each level who are CS majors, women, or underrepresented minorities.


