Generation CS, Three Years Later
In 2017, CRA published the Generation CS report on the surge in undergraduate computer science enrollments, based on data gathered through an Enrollments Survey of doctoral and non-doctoral academic units of computer science in fall 2015.
Since then, enrollments have continued to grow. In fall 2018, as part of the Taulbee Survey of doctoral departments, CRA included some questions to assess the current impact. Are academic units still struggling, or has the increase become the new normal? What changes have occurred in department resources or policies? What is the observed impact on students and faculty, including student diversity?
In 2015, 134 academic units responded to the survey. In 2018, 141 responded to the questions about impact and action, and an additional 20 responded to the course-level enrollment questions. The number responding both years is 114. Because not all units answer all questions, the basis of year-to-year comparisons varies.
Finding 1. Enrollment Increases Continue With Little Sign of Slowing.
Figure 1 (replicating Figure B5 from the 2018 Taulbee Survey report) shows that the average number of CS majors per reporting department and the average number of new majors have continued to increase since the Generation CS report. From 2015 to 2018, average new majors increased 52% and average total majors increased by 35%.
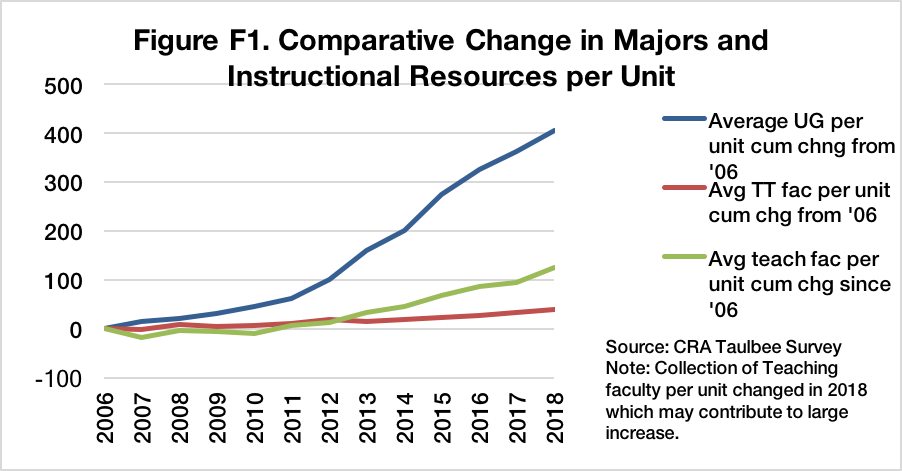
Figure 2 (replicating Figure F1 from the 2018 Taulbee Survey) shows that the growth in average undergraduates per academic unit continues to outstrip growth in tenure-track faculty (increase from 2015 to 2018 of 35% in undergraduate majors/unit and 13% in tenure-track faculty). The growth in non-tenure-track teaching faculty is beginning to keep pace with enrollment growth with an increase of 35% from 2015 to 2018, but this is not yet making up for the years in which enrollment growth greatly exceeded faculty growth.
Figure 1. Average New and Continuing CS Majors per Academic Unit (U.S. CS Only)
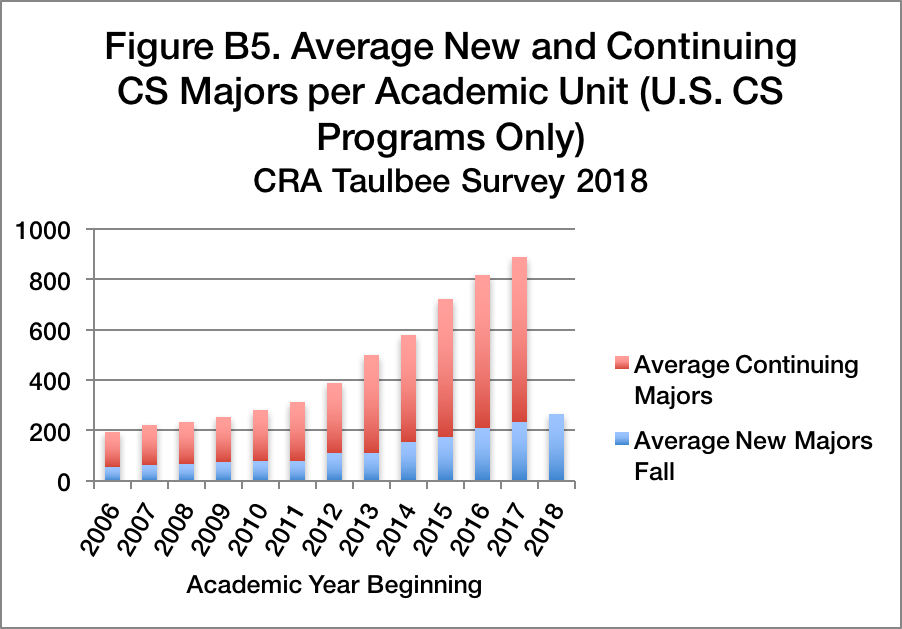
Figure 2. Comparative Change in Majors and Instructional Resources per Unit
Finding 2. Enrollment growth continues to have an impact on academic units. On average, there is greater impact for public than for private institutions, and greater impact where enrollments increased the most from 2015-2018.
In 2015, doctoral units reported the following levels of impact from enrollment growth:
Big impact with significant challenges 65%
Beginning to impact unit 12%
Have seen increase but manageable so far 19.5%
No noticeable increase or Other 3.2%
In 2018, units reported the following effects of enrollment growth on management of the unit compared to 3 years ago:
Much easier 0%
Somewhat easier 3%
About the same 14%
Somewhat more difficult 33%
Much more difficult 50%
The 2015 survey was sent only to CS departments, including those at Canadian institutions, but not to US CE or Information units. In 2018 respondents included 10 Canadian, 2 US CE, and 7 US Information units as well as 122 US CS. The Canadian and Information units agree with US CS units that enrollment growth has made management of the unit more difficult now than three years ago (60% of Canadian units and 71% of Information units say much more difficult.).
Among US CS programs, units were more likely to report that management was much more difficult than three years ago if:
- They were public rather than private (52% report much more difficult vs. 39%)
- They experienced a greater increase in CS majors as reported to Taulbee (average 3-year enrollment increase of 39% for those saying management was somewhat more difficult vs. 66% for those saying it was much more difficult; significant by t-test p<.03)
Finding 3. In many places there have been institutional changes affecting the context of CS undergraduate education since 2015. However, these changes are not significantly related to either level of impact or to undergraduate enrollment increase between 2015-2018.
The responding academic units reported the following kinds of changes:
New computing degree programs 45.5%
Change in resource allocation 44.4%
Change in responsibility for nonmajors 34.3%
Change in admission or major declaration 29.3%
Other change 6.1%
Location within hierarchy change 4.0%
Finding 4. Nonmajor enrollment in CS courses continues to grow. The percent of nonmajors at different course levels has changed little since 2015. Therefore, as the number of majors continues to expand, the number of nonmajors is growing proportionately.
In the Generation CS report, we said: In addition to the growth in majors, more nonmajors are taking computing courses past the introductory level, and more students are minoring in CS. Analyses that look only at the number of CS majors understate the demand being placed on academic units. This continues to be true.
Table 1 shows the median % majors at 4 course levels from 2015-2018 for departments responding all years. Percent nonmajors is, of course, the inverse. Not including the Intro for Nonmajors course, which is hard to interpret because of variations across institutions, the median percent of majors at the introductory level has increased slightly since 2015, while the median percent of majors at the mid-level and upper level has held more or less steady.
Table 1. Median % Majors in Representative Course for Units Responding All Years 2015-2018. (source: Taulbee Table B9)
| Median % Majors | ||
| 2015 | 2018 | |
| Intro for Majors | 42.0 | 48.4 |
| Mid-Level | 61.5 | 58.8 |
| Upper-Level | 83.3 | 86.8 |
Finding 5. Women and underrepresented minorities continue to have low representation in CS enrollment, but they have not lost ground as overall enrollments increase and in fact have gained a little ground since 2015.
The Generation CS report said: Despite concerns that actions to manage the enrollment surge would disproportionately affect women and underrepresented minorities (URM), as occurred in earlier booms, the data so far shows good news in terms of the number of women and underrepresented minorities enrolling in computing classes in aggregate. However, not all units are experiencing this growth.
In 2015, the percent of women among CS majors was 16.5; in 2018, it was 19.5.
In 2015, the percent of URM among CS majors was 11.3; in 2018, it was 12.6.
Table 2 shows the differences in median course-level enrollment for women and URM between 2015 and 2018 (source: Taulbee Table B9). As with the total enrollment, both groups have made progress since 2015 but only time will tell if this is a sustained trend.
Table 2. Representative Course Enrollments for Departments Responding All Years.
| Median % Women in Representative Course | Median % Underrepresented Minority in Representative Course | |||
| 2015 | 2018 | 2015 | 2018 | |
| Intro for Majors | 20.6 | 21.6 | 12.2 | 15.2 |
| Mid-Level | 18.4 | 23.3 | 12.0 | 14.1 |
| Upper-Level | 15.6 | 17.6 | 9.4 | 12.2 |
Finding 6. More units report considering diversity impacts when choosing actions to respond to enrollment increases, but there is no significant change in the low percentage choosing for or against specific actions because of diversity concerns.
In 2015 we reported: While many units (46.5%) stated they consider diversity impacts when choosing actions, very few (14.9%) chose actions to reduce impact on diversity and even fewer (11.4%) decided against possible actions out of concern for diversity.
In 2018, those numbers were 56.5%, 13.0%, and 13.7% respectively. Comparing units who answered the questions both years, the change for considering diversity impacts was significant by t-test (p<.01) but the other two differences were not significant.
Finding 7. The four areas showing the most stress in 2015 continue to show the most stress in 2018: Sufficient faculty/instructors relative to demand, demand for classroom space, sufficient TAs, and faculty workload.
In 2015 we said: Units have experienced stresses in available space, instructional resources, and faculty workload.
As shown in Table 3, the same areas are continuing to present problems.
Table 3. Areas Causing Somewhat or Significant Problems in 2015 and 2018.
| 2018 | 2015 | |||||
| Somewhat of a problem | Significant problem | Rank Order Somewhat + Signif | Somewhat of a problem | Significant problem | Rank Order Somewhat + Signif | |
| Demand for classroom space | 33.3 | 58.2 | 2 | 19.8 | 77.5 | 1 |
| Demand for laboratory space | 48.1 | 37 | 5 | 30.6 | 55 | 6 |
| Demand for office space | 34.1 | 48.9 | 6 | 28.8 | 55 | 7 |
| Faculty workload | 40.3 | 47.5 | 4 | 30.6 | 61.3 | 3 |
| Sufficient faculty/instructors relative to need | 30.5 | 62.4 | 1 | 26.1 | 68.5 | 2 |
| Sufficient TAs relative to need | 46 | 42.4 | 3 | 24.5 | 67.3 | 4 |
| Sufficient advising or administrative support | 51.4 | 30.4 | 7 | 41.8 | 47.3 | 5 |
| CS majors having trouble getting access to required CS courses | 49.2 | 21.2 | 11 | 47.3 | 31.8 | 8 |
| CS majors having trouble getting access to CS courses of interest (e.g. elective requirement) | 51.2 | 27.1 | 8 | 42.1 | 25.2 | 11 |
| Nonmajors having trouble getting access to required CS courses | 41.9 | 36.3 | 9 | 32.4 | 45.7 | 9 |
| Nonmajors having trouble getting access to CS courses of interest | 35.3 | 26.9 | 12 | 35.6 | 31.7 | 11 |
| Time for faculty research/scholarship | 47.9 | 28.9 | 10 | 37.7 | 32.1 | 10 |
| Student performance and/or student learning declining due to increased enrollments | 40.5 | 7.2 | 13 | 34.1 | 9.1 | 13 |
Finding 8. There are no significant differences in the percentage of units taking various actions to manage enrollment between 2015 and 2018. The most popular actions continue to be increasing faculty (tenure-track, teaching, and/or visitors/adjuncts).
In 2015 we reported: Units are using or are planning to use a wide range of approaches to manage enrollments, manage enrollment related resources, and reduce the demands on faculty while trying to meet the needs of both majors and nonmajors. Many units have increased class sizes and reduced some course offerings and faculty activities.
The 2018 survey re-asked about many of the possible actions from 2015. There are some fluctuations in the percentage of units having taken or considering each action, but none of the changes are statistically significant (Table 4).
Table 4. Percent of units who have done or are planning/considering each action.
| % Done or considering | |||
| N both years | 2015 | 2018 | |
| Tighten requirements for declaration/admission to major | 76 | 49 | 50 |
| Restrict upper level courses to majors or majors and minors | 84 | 70 | 65 |
| Restrict upper level courses some other way | 41 | 42 | 32 |
| Limit enrollment in high-demand classes | 86 | 58 | 64 |
| Advise less successful students to other majors | 65 | 55 | 62 |
| Reduce courses for non-majors | 67 | 34 | 40 |
| Reduce small enrollment classes | 75 | 64 | 75 |
| Increase online offerings | 65 | 43 | 49 |
| Increase blended offerings | 59 | 54 | 59 |
| Raise the bar for doing well in prerequisite classes | 61 | 20 | 23 |
| Spin off service classes | 48 | 15 | 19 |
| Increase tenured/tenure-track faculty | 84 | 85 | 87 |
| Increase teaching faculty | 83 | 86 | 92 |
| Increase visiting faculty or adjuncts | 77 | 84 | 81 |