Rates of Participation in K-12 Outreach Vary Among Undergraduates in Computing
Past research has shown that when computer science undergraduates engage in K-12 outreach activities, both they and their outreach audience can benefit from the experience (e.g., Kafai, et al., 2021). How common is it for undergraduate students in computing to do K-12 outreach, and does this vary among different groups of students?
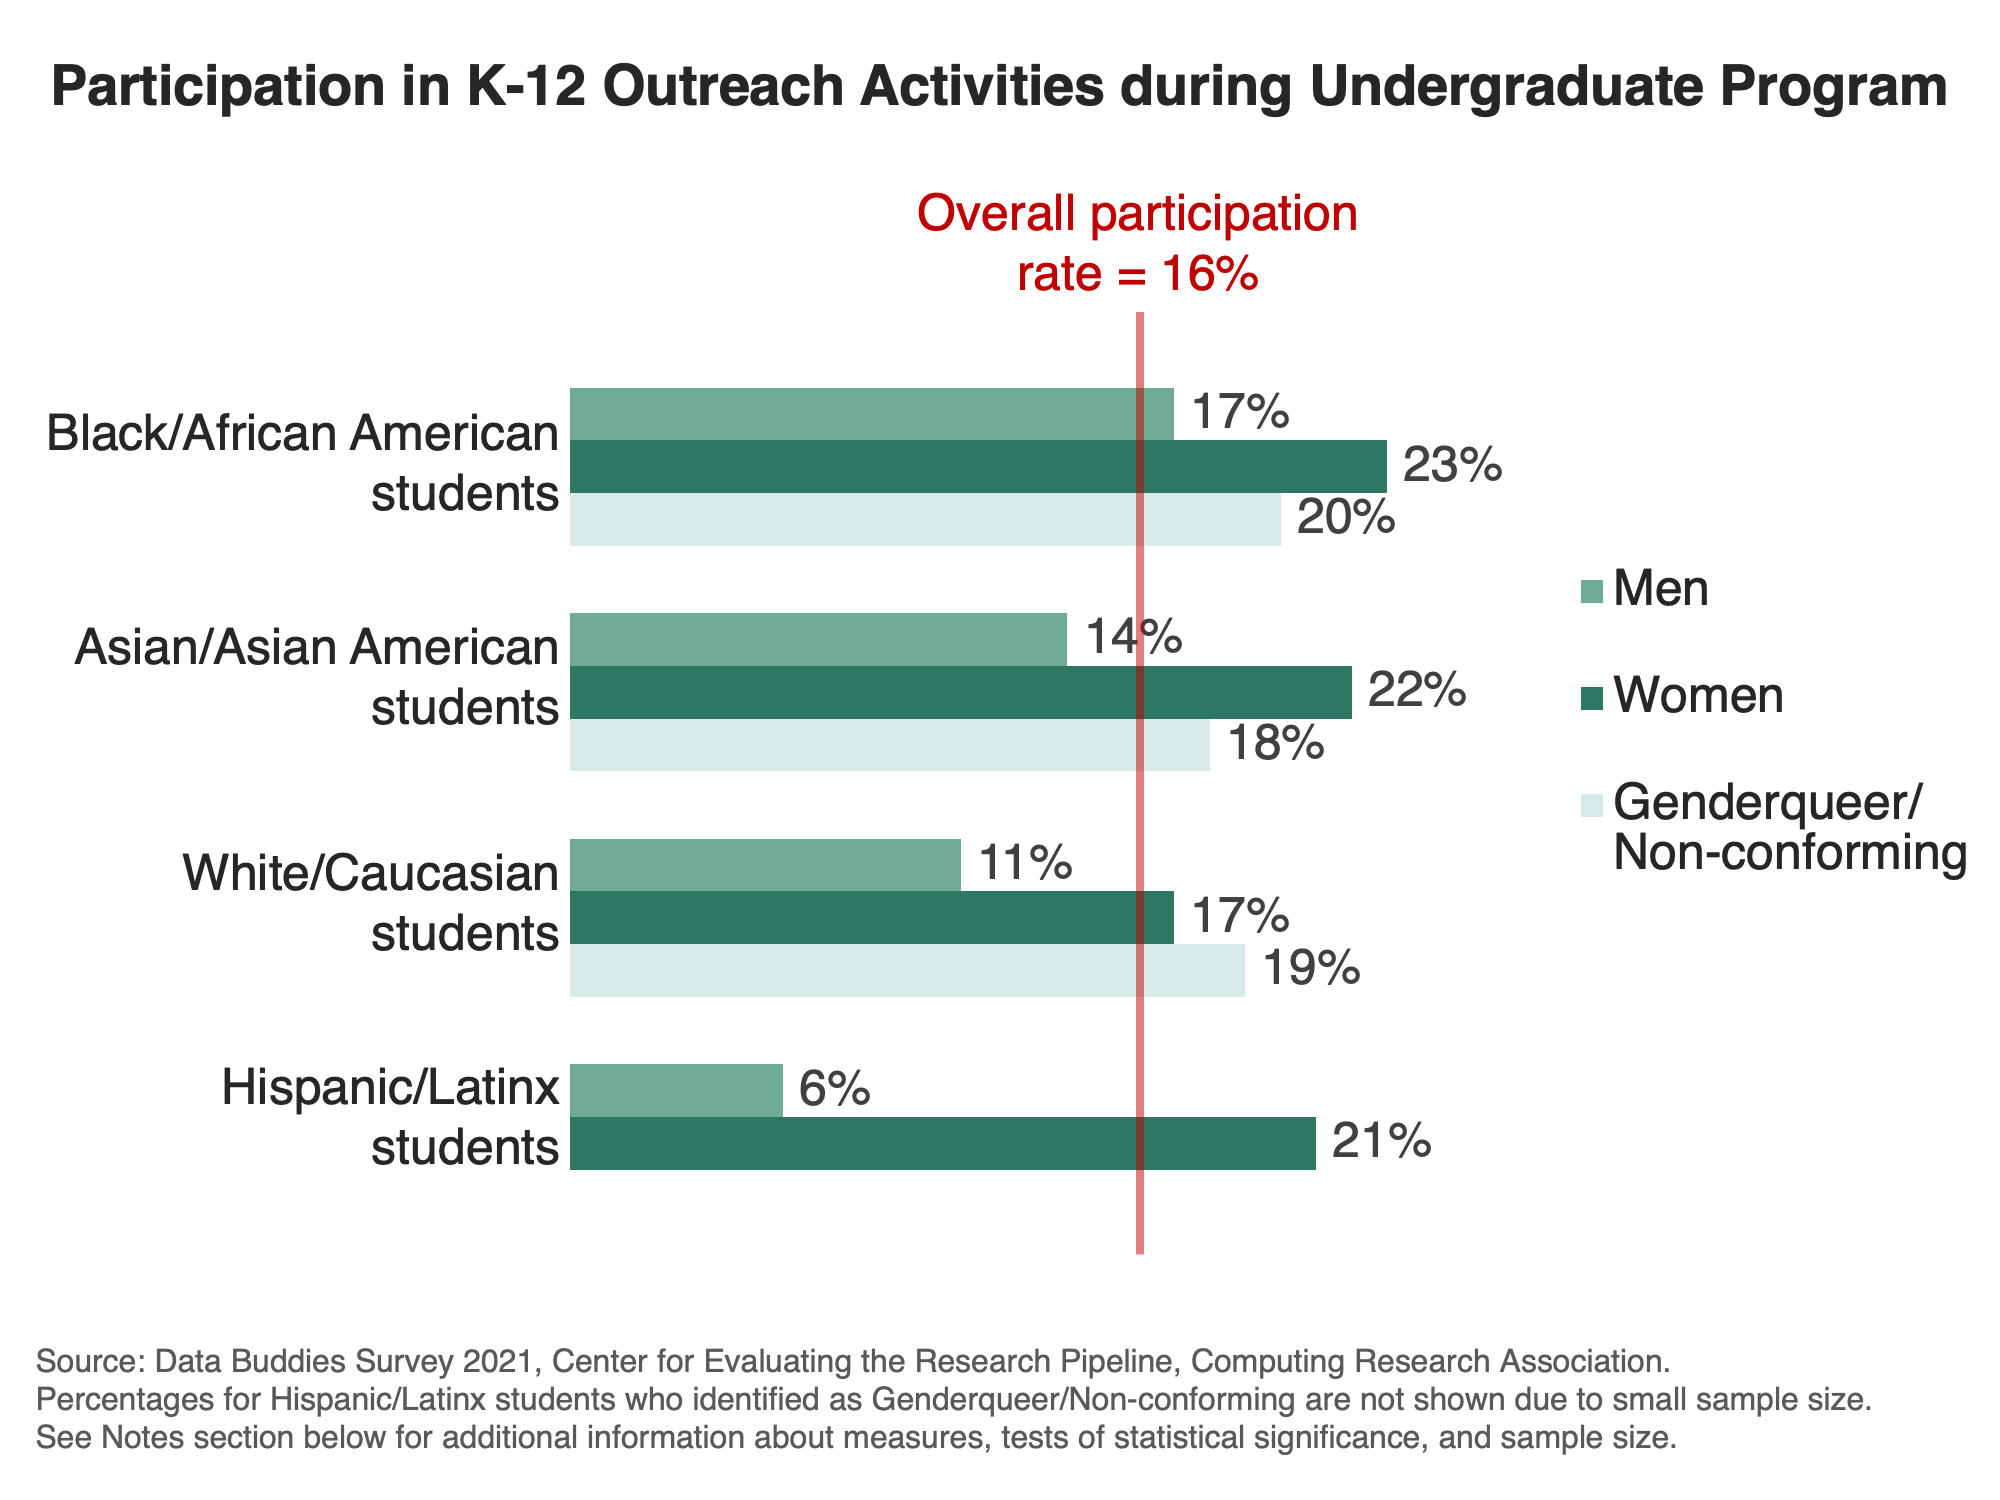
The figure above displays the percentage of undergraduates in the 2021 Data Buddies Survey who indicated that they had taken part in K-12 outreach once or more during their current undergraduate program. Across all undergraduate survey respondents, 16% of students had participated in K-12 outreach activities at least once. However, there was also a large amount of variability in K-12 outreach experience among students with different racial/ethnic and gender identities. Overall, Black and Asian students had the highest rates of K-12 outreach participation, and women and genderqueer/non-conforming students participated at significantly higher rates than men did. Black women had the highest rates of participation in K-12 outreach (23%), and Hispanic/Latino men had the lowest participation rates (6%).
Reference:
Kafai, Y., Griffin, J., Burke, Q., Slattery, M., Fields, D., Powell, R., Grab, M., Davidson, S., & Sun, J. (2013, March). A cascading mentoring pedagogy in a CS service learning course to broaden participation and perceptions. In Proceeding of the 44th ACM Technical Symposium on Computer Science Education(pp. 101-106).
Notes:
The survey data analyzed for this infographic were collected by Center for Evaluating the Research Pipeline via The Data Buddies Project. Overall K-12 outreach participation rates were based on 10,238 undergraduate students who provided a response to the question: “How often have you been involved in K-12 outreach during your current program?” Responses options were “Never,” “Once,” “Two or three times,” or “Four or more times.” These were collapsed into two groups: those who had never participated versus those who participated once or more. Statistically significant differences for race/ethnicity and gender identity were based on z-tests with Bonferroni-corrected p values and are as follows: participation by race/ethnicity: Black students and Asian students > White students; participation rates by gender: women and genderqueer/ nonconforming > men.
 This analysis is brought to you by the CRA’s Center for Evaluating the Research Pipeline (CERP). CERP provides social science research and comparative evaluation for the computing community. Subscribe to the CERP newsletter here. Volunteer for Data Buddies by signing up here.
The Data Buddies Project is currently supported through National Science Foundation (NSF) awards CNS-1840724, CNS-2036717, DUE-1821136, sub-awards and contracts, and direct CRA contributions. Previous NSF awards that supported DBS include CNS-1246649 and DUE-1431112. Any opinions, findings, and conclusions or recommendations expressed in this material are those of the author(s) and do not necessarily reflect the views of the National Science Foundation.