
Mentoring and Teaching Activities Among Undergraduate Computing Majors by Gender Identity
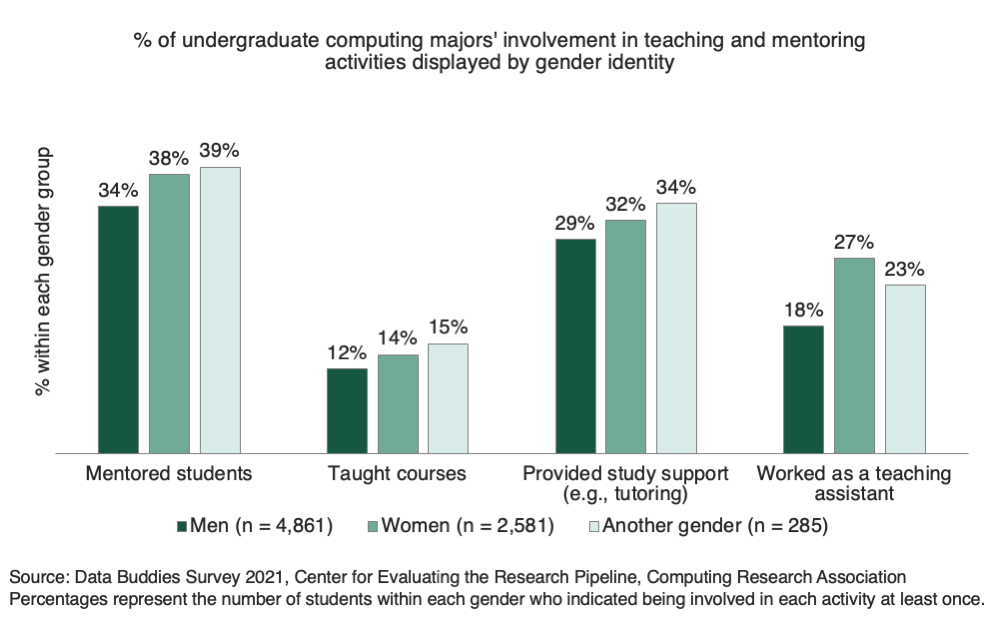
Undergraduate students are presented with opportunities to grow as future professionals during their undergraduate studies. The Data Buddies Survey collects data on a wide range of professional development activities, including those related to mentoring and teaching other students. During the fall semester, undergraduate computing majors [1] were asked to report how often (never, once, two or three times, four or more times) they were involved in the following activities: mentored students, taught courses, provided study support in computing (e.g., provided tutoring; supplemental Instruction [SI]), and worked as a teaching assistant (TA).
In this infographic, we compared students’ involvement in teaching and mentoring activities by their reported gender identity [2]. Results indicate statistical differences between groups at the p ≤ .05 level: men were less likely than women to have mentored other students, taught courses, and worked as a TA. There were no statistically significant differences between groups in their involvement providing tutoring to others. Across all four measures, there were no statistical differences between those with another gender and those who identified as men or women. This is likely due to the relatively smaller sample and effect size (n = 285). Overall, fewer students engaged in teaching courses and working as a TA compared to those mentoring and tutoring other students. This is likely due to students having easier access to participating in these activities compared to TA or teaching opportunities.
Notes:
The survey data analyzed for this infographic were collected by Center for Evaluating the Research Pipeline via The Data Buddies Project. Sample included 7,780 undergraduate computing majors who provided their gender in the demographics portion of the survey. Men, women, and those with another gender were compared using a z-test and Bonferroni-corrected p values.
[1] “Computing major” includes those who were majoring in computer science, computer engineering, software engineering, electrical and computer engineering, electrical engineering and computer science, information technology, computer information systems/informatics, bioinformatics/computational biology, computing and business, data science/analytics, game design, or any other computing & technology major (displayed choice as “Other computing & technology major”).
[2] Gender identity was collected using the following question: “What is your gender identity?”. Response options included “Man”, “Woman”, “Genderqueer/gender non-conforming/non-binary”, “Agender”, and “Something else”. Respondents that selected the last three options were grouped together as “Another gender” for the purpose of this analysis.
 This analysis is brought to you by the CRA’s Center for Evaluating the Research Pipeline (CERP). CERP provides social science research and comparative evaluation for the computing community. Subscribe to the CERP newsletter here. Volunteer for Data Buddies by signing up here.
The Data Buddies Project is currently supported through National Science Foundation (NSF) awards CNS-1840724, CNS-2036717, DUE-1821136, sub-awards and contracts, and direct CRA contributions. Previous NSF awards that supported DBS include CNS-1246649 and DUE-1431112. Any opinions, findings, and conclusions or recommendations expressed in this material are those of the author(s) and do not necessarily reflect the views of the National Science Foundation.


