Computing Bachelor’s Degrees Awarded vs US College Age Population by Race/Ethnicity and Gender/Sex (2022)
By Burçin Campbell, Director of Data and Evaluation
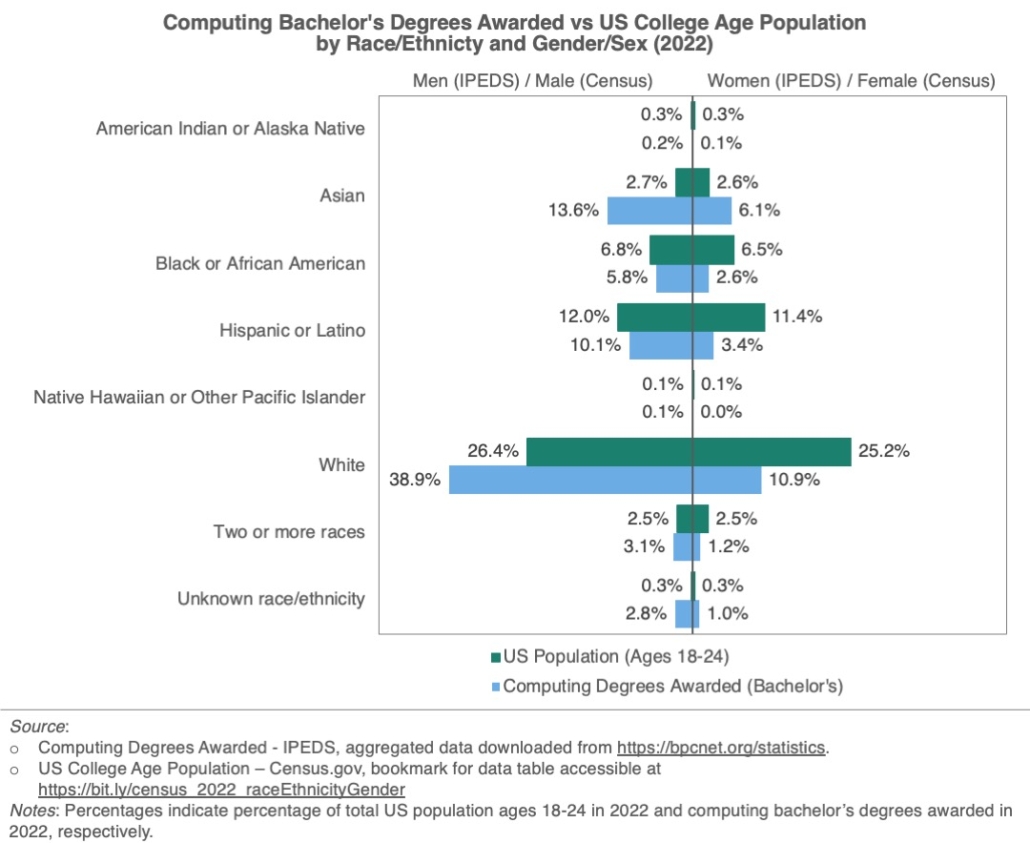
Understanding the patterns of representation of various groups in any given context is important for identifying potential problem areas that may impact people with particular backgrounds or identities to participate in that context. This infographic focuses on the demographic patterns of representation in the field of computing higher education. Specifically, the bar graph shows computing bachelor’s degrees awarded in the US higher education Institutions and college age US population (ages 18-24) broken down by gender/sex and race/ethnicity.
Before reviewing the results, it is important to note that US Census and IPEDS, the two data sources used in this analysis, report demographics slightly differently in that the Census includes an indicator for sex (male/female) while IPEDS includes an indicator for gender (men/women). Therefore, this graphic is relying on an approximate comparison. Further, IPEDS data does not identify race/ethnicity for any degrees awarded to non-US citizen/non- US resident students. For the purposes of this graphic, these degrees were excluded from analysis.
With that caveat in mind, there are two main observations from this graphic. First, overall, there is an underrepresentation of women in computing higher education regardless of race/ethnicity. While the US college age population is evenly distributed between individuals who identify as male and those who identify as female for all racial/ethnic groups, the computing degrees are less likely to be awarded to women in all racial/ethnic groups. Second, there are significant differences in various groups’ representation in the college age population and in computing higher education.
Largest differences for groups which have a higher percentage in the computing higher education compared to the college age US population exist for Asian men, Asian women, and White men. On the other hand, largest differences for groups which have lower percentage of representation in computing higher education compared to the college age US population exist for Black and African American women, Hispanic and Latino women, and White women.
Future work will include examination of data patterns over time and comparisons with total bachelor’s degrees awarded in all fields of study. You can find institution level statistics and access more data on the BPCnet.org Statistics and Data Hub.
Notes:
- All percentages were compared using two-proportion comparison tests between computing higher education and college age US population and all differences were statistically significant at 0.05 significance level (p-value < 0.05).
- The effect sizes were also calculated based an h-value and differences with highest effect sizes were highlighted in the text.
This analysis is brought to you by the CRA’s Center for Evaluating the Research Pipeline (CERP). CERP provides social science research and comparative evaluation for the computing community. Subscribe to the CERP newsletter here. Check out CERP’s activities and find out how to engage on CERP’s website.
This material is based upon work supported by the National Science Foundation under Grant Number (CNS 1940460). Any opinions, findings, and conclusions or recommendations expressed in this material are those of the author(s) and do not necessarily reflect the views of the National Science Foundation.