
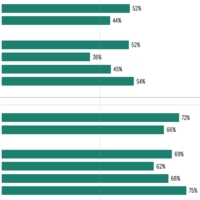
Who is Welcome in Computing?
Analysis of how welcome students feel in computing by intersections of race/ethnicity and gender, and disability status and gender shows that there are significant differences between students from various demographic groups ranging from 36% (Black women) to 75% (White men) of students in each group.


