Who is Welcome in Computing?
Intrinsic factors such as level of interest in the field do not guarantee successful recruitment and retention of all students in computing. Many students who come from demographic backgrounds that are currently underrepresented in computing do not start off being uninterested in computing. In fact, studies [1] at the middle and high school levels have found that students from some of the racial/ethnic groups currently underrepresented in computing, specifically Black and Hispanic students, report a higher level of interest in computing than their White counterparts. Somewhere along the line, those Black and Hispanic students do not end up in computing majors when they get to college.
There are many psychological and socio-economic reasons why some students’ pathways diverge from a career in computing (e.g., lack of prior exposure, not having enough role models in the field). How welcoming the field has to do with of a number of these reasons. For instance, if classes are structured in a way that strongly emphasizes prior engagement with computing, students who are coming from disadvantaged backgrounds will be less likely to succeed and to feel like their experiences are valued in computing.
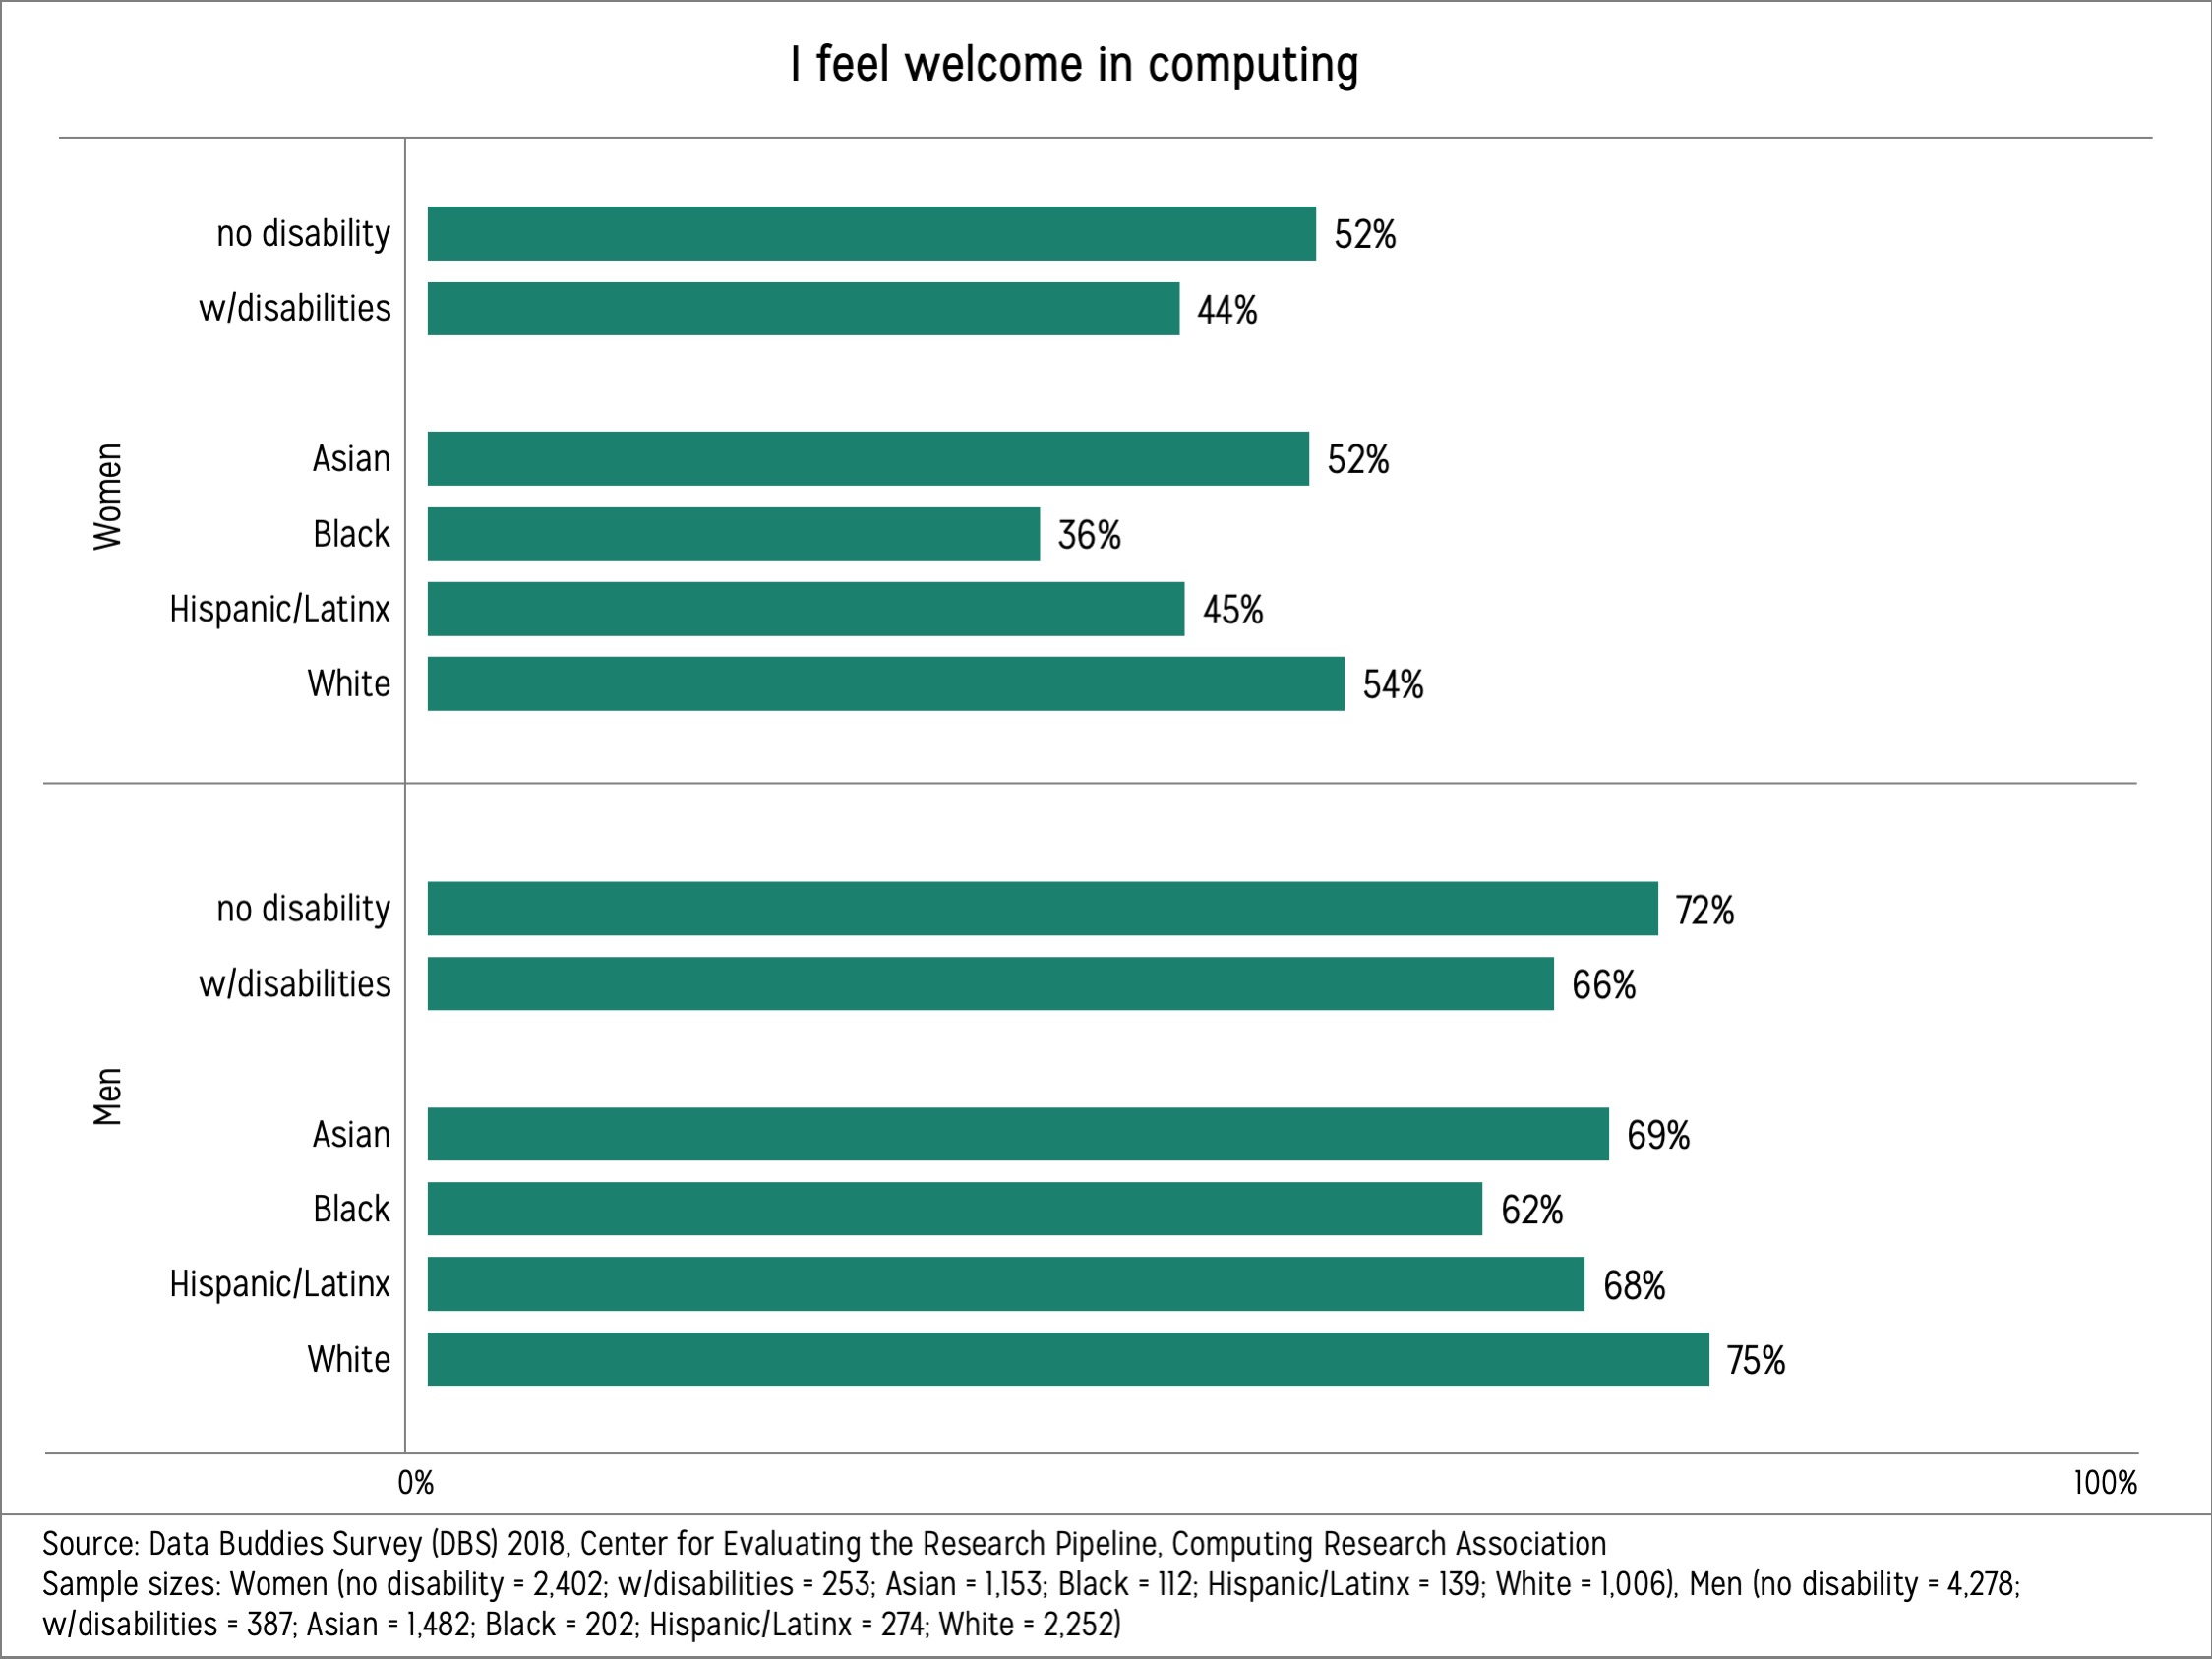
This graphic presents a picture of how welcoming the field of computing is to different groups of students. It shows undergraduate students’ responses to a question in the 2018 CRA Data Buddies Survey (DBS) asking their level of agreement with the statement “I feel welcome in computing”. The bars represent percentage of students in each group who selected “somewhat agree” or “strongly agree”. The analysis specifically focused on the intersections of race/ethnicity and gender, and disability and gender.
Across all racial and ethnic groups and regardless of disability status, women feel less welcomed in computing than men do with only 54% or less reporting agreement with being welcomed in computing. Among women, White and Asian women feel the most welcome followed by Hispanic and Black women. Only 36% of Black women said they would agree with the statement “I feel welcome in computing”. Fifty two percent of women without any disabilities and 44% of women with disabilities said they felt welcome in computing.
On the other hand, 75% of White men in the DBS sample reported feeling welcome in computing. This percentage was 69% for Asian men, 68% for Hispanic men, and 62% for Black men. While 72% of men with no disabilities said they felt welcome in computing, this number was only 66% for men with disabilities.
To put these numbers in perspective, the percentage of White men (75%) who reported feeling welcomed in computing was more than double that of Black women (36%). This rather large range in percentages indicates the significant differences in how students from different backgrounds experience being in the field of computing. Given the importance of feeling welcomed in the field for retaining (and for recruiting) students, these results indicate that computing community is facing a challenge that needs to be addressed urgently if efforts to broaden participation in computing are to succeed.
References:
[1] Google Inc. & Gallup Inc. (2017, December). Encouraging Students Toward Computer Science Learning. Results From the 2015-2016 Google-Gallup Study of Computer Science in U.S. K-12 Schools (Issue Brief No. 5). Retrieved from https://goo.gl/iM5g3A .
Notes:
- The survey data used in this graphic were collected during fall 2018 by CERP via the Data Buddies Project.
- Students were asked to rate their level of agreement with the statement “I feel welcome in computing” on a scale of 1 (strongly disagree) to 5 (strongly agree).
- The survey sample contains 8,795 students who responded to the question of interest (feeling welcome in computing). Of these 7,320 students reported both gender and disability status, and 7,800 reported both race/ethnicity and gender.
- Only individuals who identified as woman or man are included here as a result of a very small sample size for students who identified as non-binary.
- The survey included the following racial/ethnic groups: African/African American/Black, American Indian/Alaska Native, Arab/Middle Eastern, Caribbean/Puerto Rican, Caucasian/European/White, East Asian, Southeast Asian, South Asian, Other Asian, Mexican American/Chicano, Other Hispanic/Latino/a, Native Hawaiian/Pacific Islander, Other. Students identifying with any of the Asian identities were grouped together; and students who identified as Caribbean/Puerto Rican, Mexican American/Chicano, and Other Hispanic/Latino/a were grouped together. Students who identified as American Indian/Alaska Native, Arab/Middle Eastern, or Native Hawaiian/Pacific Islander were not included in this analysis due to small sample sizes. Students who selected more than one race/ethnicity were also not included in the graphic shown here but the results do not change when they are included in each of the racial/ethnic groups they selected.
- The disability status was based on students’ self-reported identification.
- Two proportion t-tests show that differences (conducted within women and men) between Black women and White women, and Black women and Asian women; White men and men from the three other racial/ethnic groups; Black men and Asian men; women with disabilities and women with no disabilities; men with disabilities and men with no disabilities are statistically significant at 5% significance level.
- The average for the 1-5 scale values for each group is: Women (no disability = 3.44; w/disabilities = 3.18; Asian = 3.46; Black = 3.10; Hispanic/Latinx = 3.37; White = 3.42), Men (no disability = 3.93; w/disabilities = 3.84; Asian = 3.85; Black = 3.71; Hispanic/Latinx = 3.84; White = 4.00).
 This analysis is brought to you by the CRA’s Center for Evaluating the Research Pipeline (CERP). CERP provides social science research and comparative evaluation for the computing community. Subscribe to the CERP newsletter here.
This material is based upon work supported by the National Science Foundation under grant numbers (CNS-1246649, CNS 1840724, DUE-1431112, and DUE 1821136). Any opinions, findings, and conclusions or recommendations expressed in this material are those of the author(s) and do not necessarily reflect the views of the National Science Foundation