Participation Rate in Computing-Related Contests Highest Among Men, and Among Asian Students
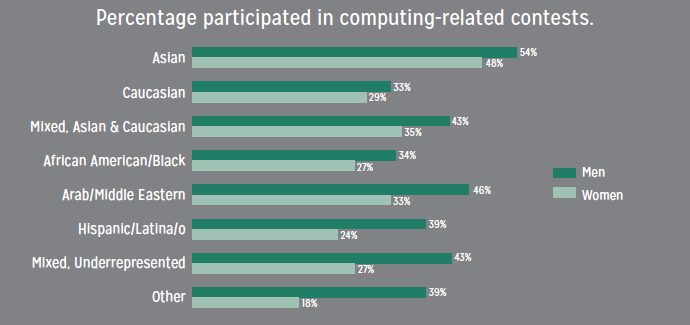
During the fall 2016 academic semester, CERP collected data from 5,208 undergraduate students currently or previously enrolled in computing courses at a sample of U.S. colleges and universities. Students were asked whether they had participated in any computing-related contests (e.g., hackathons or robotics competitions) during the past year. Some believe this type of activity can help resumes stand out and makes applicants competitive on the job market (e.g., Harnett, 2016; Mone, 2016). We found men were more likely than women, and Asian students were more likely than their peers, to report having participated in computing-related contests. To help promote a level applicant playing field, contest organizers should consider modifying recruitment strategies to target groups who are less likely to participate, such as women.
Note: “Mixed, Asian & Caucasian” students are those who identified as both Asian and Caucasian. “Mixed, Underrepresented” students are those who identified with more than one ethnic group, at least one of which was the following: Arab/Middle Eastern, African American/Black, Hispanic/Latina/o, Native American, or Pacific Islander. “Other” students are those who identified as Native American, Pacific Islander, or more than one ethnic group that were not specified. Sample sizes for each student group are as follows: Asian men = 933, women = 667; Caucasian men = 1,860, women = 686; Mixed Asian & Caucasian men = 119, women = 77; African American/Black men = 112, women = 85; Arab/Middle Eastern men = 39, women = 18; Hispanic/Latina/o men = 192, women = 79; Mixed, Underrepresented men = 193, women = 92; and Other men = 39, women = 17.
References:
Harnett, S. (2016). Hacking competitions burnish cybersecurity resume. Retrieved from: http://www.marketplace.org/2016/01/25/world/hacking-competitions-burnish-cybersecurity-resume
Mone, G. (2016). Bias in technology. Communications of the ACM, 60, 19-20.
![]() This infographic is presented by the CRA’s Center for Evaluating the Research Pipeline (CERP). CERP provides social science research and comparative evaluation for the computing community. To learn more about CERP, visit our website at https://cra.org/cerp/.
This infographic is presented by the CRA’s Center for Evaluating the Research Pipeline (CERP). CERP provides social science research and comparative evaluation for the computing community. To learn more about CERP, visit our website at https://cra.org/cerp/.
This material is based upon work supported by the National Science Foundation under Grant Number (CNS-1246649; and/ or DUE-1431112). Any opinions, findings, and conclusions or recommendations expressed in this material are those of the author(s) and do not necessarily reflect the views of the National Science Foundation.