Students’ Level of Satisfaction with Computing Degree Programs
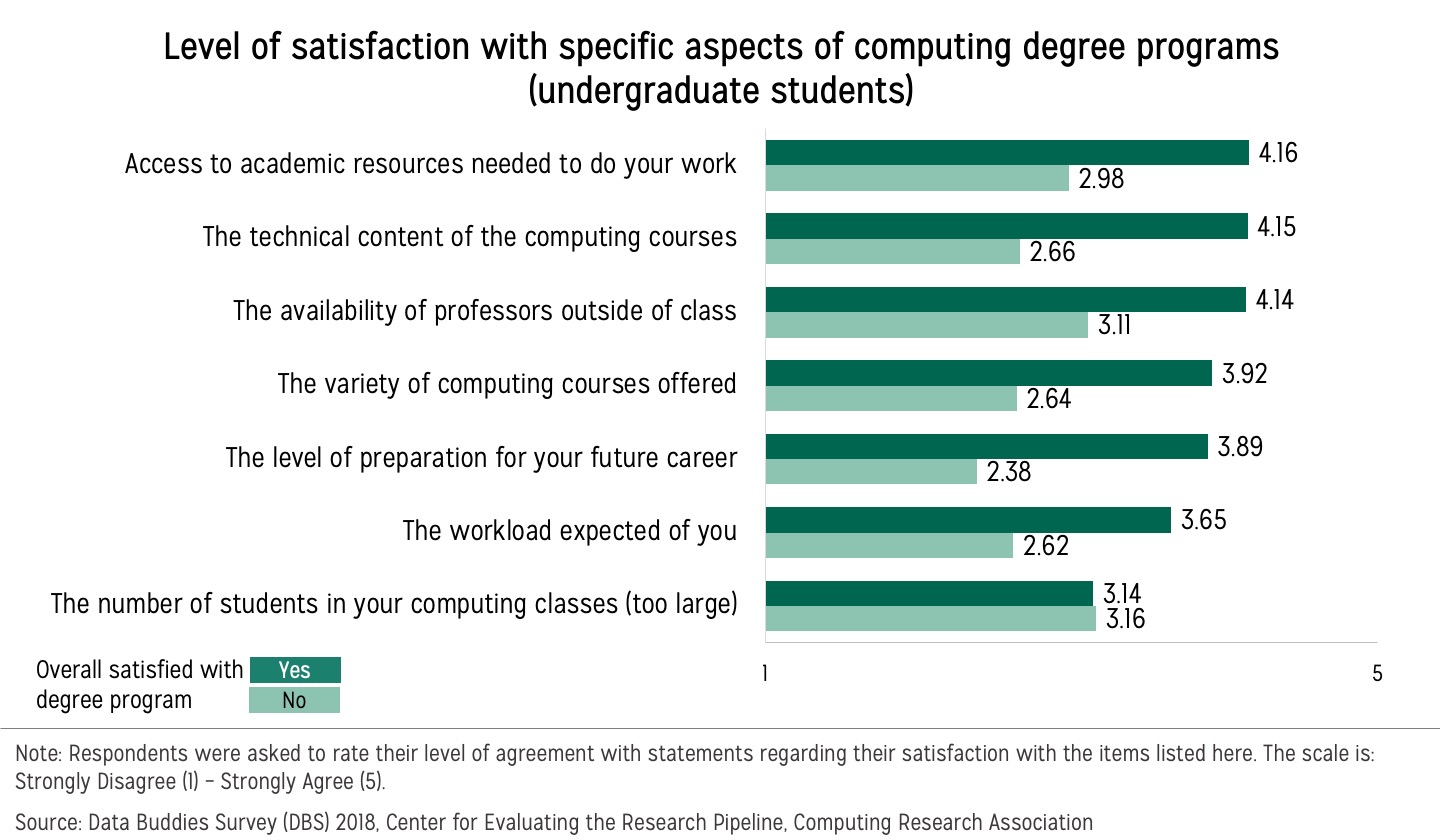
Understanding the relationship between specific aspects of a degree program and students’ overall satisfaction with the program can help departments make decisions about how to improve their degree programs. Undergraduate student data from fall 2018 Data Buddies Survey presented in this graphic show that access to academic resources, quality of the technical content of courses, and availability of professors outside of class are the top three characteristics of a program that are most closely associated with students’ overall satisfaction with the program.
Interestingly, the number of students in their computing classes being too large is not highly related to their satisfaction. In fact, on average, both students who were satisfied with the program and those who were not are approximately indifferent (neither agree nor disagree (3)) towards the importance of class size.
Students’ satisfaction with all aspects of programs reported here with the exception of class size differ by at least 1 point on the scale of 1-5 between the students who reported being satisfied with their degree program and those we did not. The quality of the technical content of courses and level of career preparation make the largest difference for whether students are satisfied with the program overall.
Notes:
The survey data used in this chart were collected during fall 2018 by CERP via the Data Buddies Project. The sample includes 6,536 undergraduate students enrolled in a computing major. Students’ overall satisfaction with their degree program was determined based on the question “Please indicate the extent to which you disagree or agree with the following statement: – Overall, I am satisfied with the computing program at my institution.” Students’ ratings of Strongly Disagree (1) and Disagree (2) were considered not satisfied and Agree (4) and Strongly Agree (5) were considered satisfied. Students who selected “Neither Agree nor Disagree (3)” were not included in these analyses. There were 5,680 students who were satisfied with their degree program and 856 who were not. The items inquiring about specific aspects of their computing degree programs and computing courses asked students’ level of agreement with statements regarding their satisfaction with the items listed here. The scale was: Strongly Disagree (1) – Strongly Agree (5).
The relationships between all items listed here as well as Likert-scale form of students’ overall satisfaction item were tested using Spearman’s correlation. The analysis showed the same relationship in that the top items shown here were strongly correlated with overall satisfaction.
 This analysis is brought to you by the CRA’s Center for Evaluating the Research Pipeline (CERP). CERP provides social science research and comparative evaluation for the computing community. Subscribe to the CERP newsletter here.
This material is based upon work supported by the National Science Foundation under grant numbers (CNS-1246649, CNS 1840724, DUE-1431112, and DUE 1821136). Any opinions, findings, and conclusions or recommendations expressed in this material are those of the author(s) and do not necessarily reflect the views of the National Science Foundation.