C/DREU Students Continue to Pursue a Graduate Degree in Computing at Higher Rates
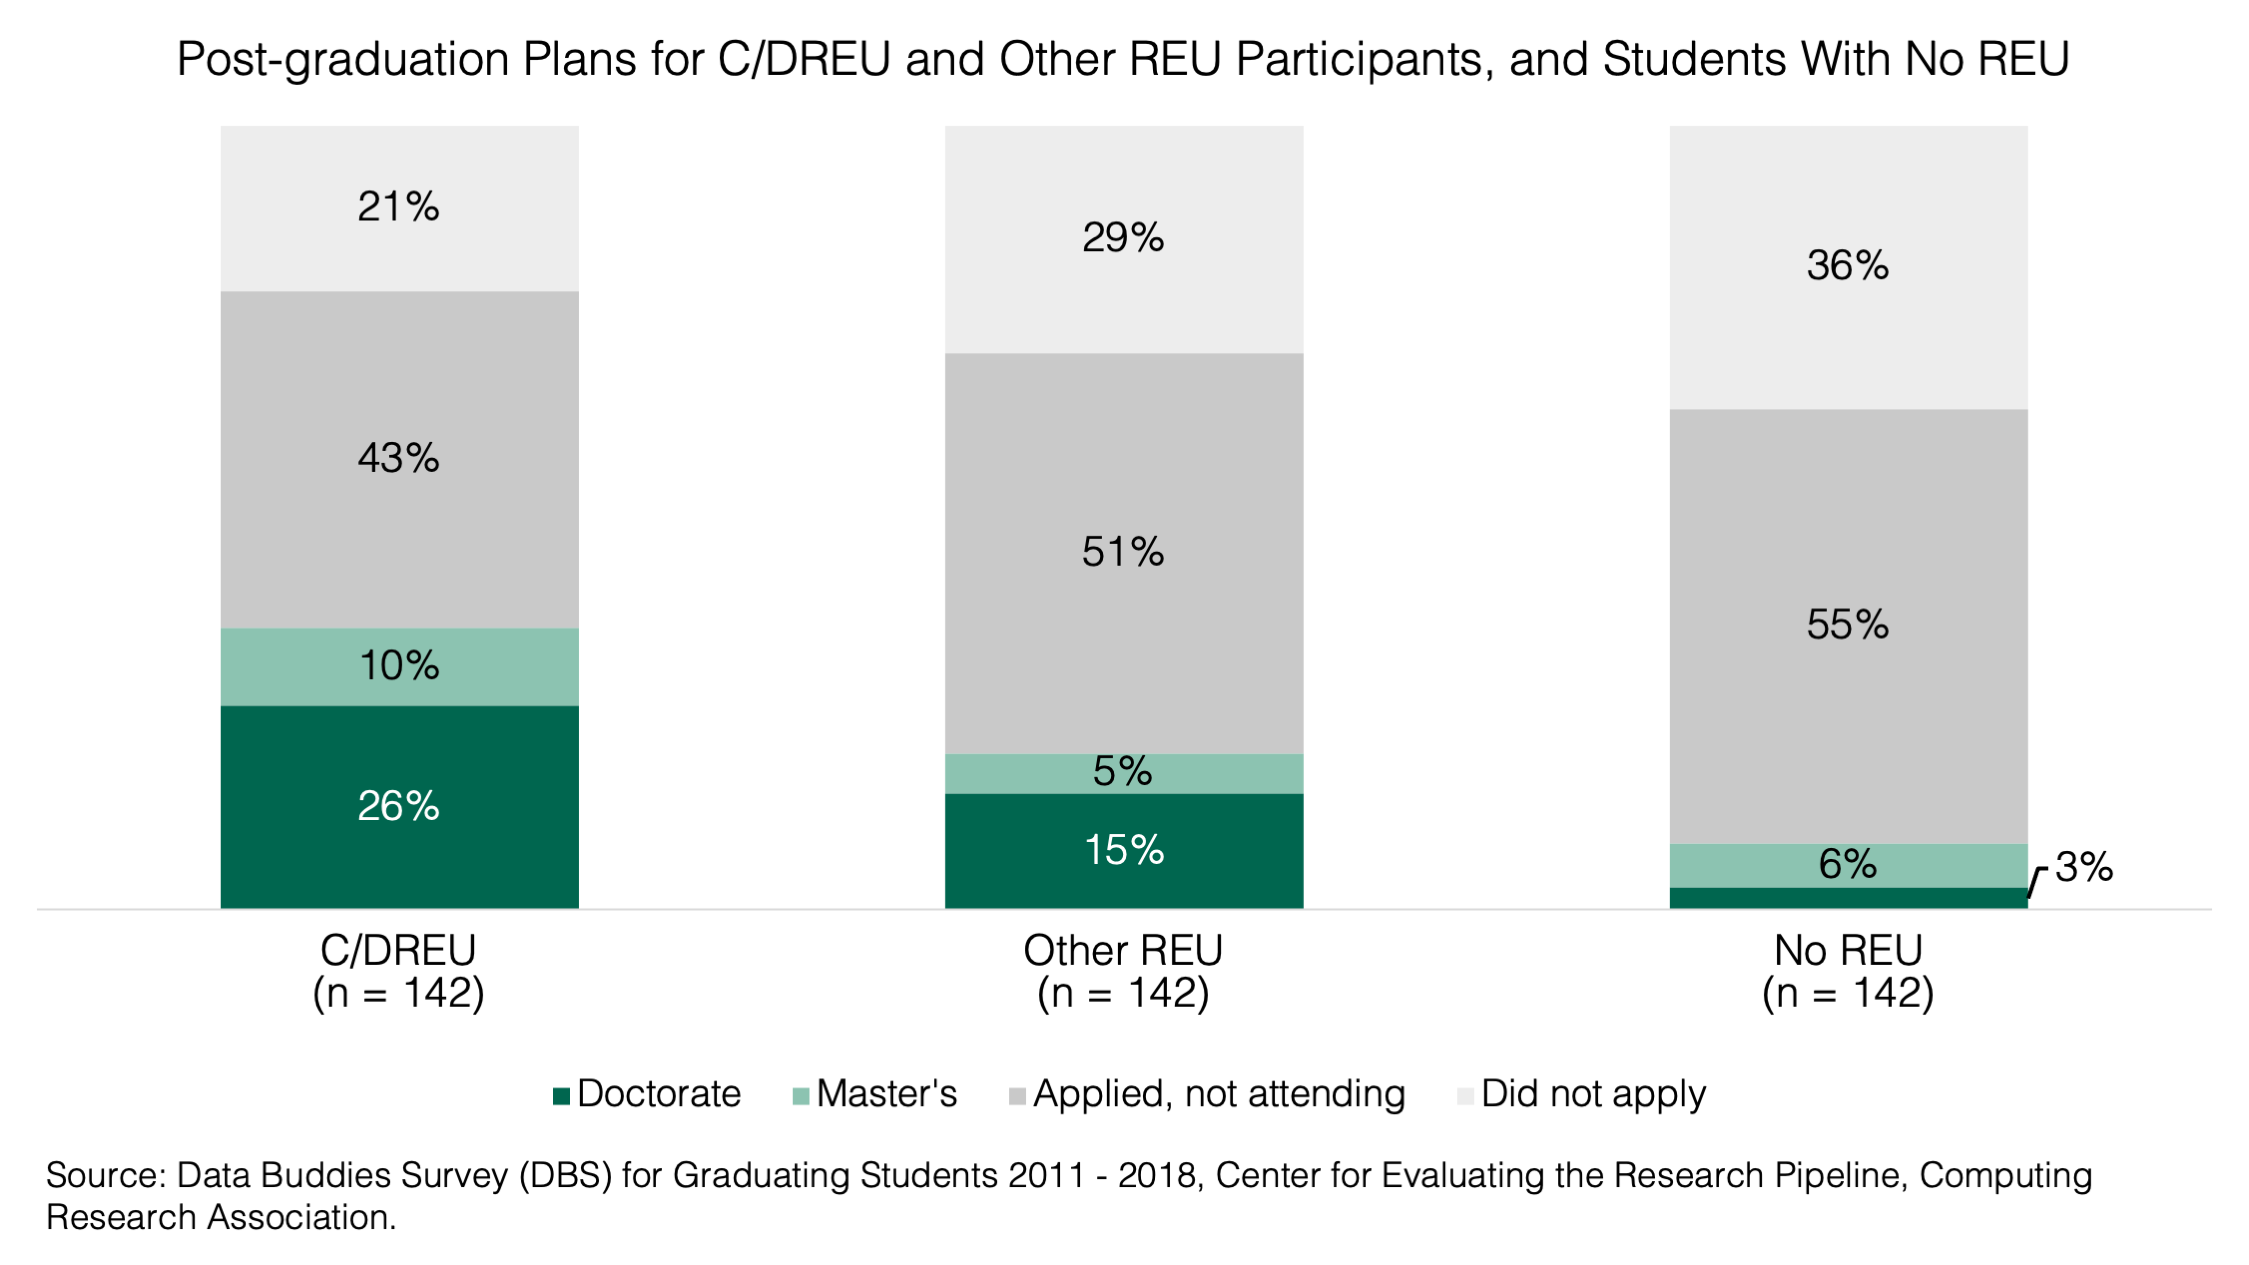
Using data collected through the CRA Data Buddies Survey for Graduating Students between 2011 and 2018, this infographic shows the post-graduation plans of students in three groups: CRA-WP’s Collaborative Research Experiences for Undergraduates (CREU) and Distributed Research Experiences for Undergraduates (DREU), students who participated in other REU programs, and students who did not participate in an REU program. The post-graduation plans are depicted as they relate to graduate school attendance. Specifically, the percentages of students in each of the three groups are reported for students who were going on to a graduate degree, who applied to graduate school but would not be pursuing a graduate degree either because they were not admitted or were choosing another pathway, and those who did not apply to graduate school at all.
Statistical tests indicated that the percentages of C/DREU participants (79%) and students who participated in another REU program (71%) apply to graduate school did not differ. However, C/DREU participants were more likely to attend graduate school (36%) than students who participated in other REU programs (20%) and students who did not participate in an REU program (9%) at all.
Students in the Other REU and No REU groups were sampled from the survey using propensity score matching based on the C/DREU participants’ characteristics in terms of race/ethnicity, gender, parents’ highest education level, and highest degree granted by the institutions they were attending at the time of the survey. This procedure is used to minimize the differences between the groups being compared. Note that this also means that the results presented in this graphic do not reflect the overall sample of students in the survey.
Notes:
- The graphic presented here extends prior analysis on CRA-WP’s Collaborative Research Experiences for Undergraduates (CREU) and Distributed Research Experiences for Undergraduates (DREU) programs by adding additional years of data from The CRA Data Buddies Survey (DBS) for Graduating Students conducted in spring 2017 and 2018 to cover 2011 to 2018. The DBS for Graduating Students was sent to students who responded to DBS in a previous year and had an expected graduation date within one-year of the Graduating Student Survey.
- Previous analysis were reported in two CRN CERP infographics in February 2016 and May 2017.
- The percentages shown in this graphic were compared using two-proportion t-tests and a difference is considered statistically distinguishable when p-value is less than 0.05.
 This analysis is brought to you by the CRA’s Center for Evaluating the Research Pipeline (CERP). CERP provides social science research and comparative evaluation for the computing community. Subscribe to the CERP newsletter here. Volunteer for Data Buddies by signing up here.
This material is based upon work supported by the National Science Foundation under Grant Number (CNS-1246649, CNS 1840724, DUE-1431112, and DUE 1821136). Any opinions, findings, and conclusions or recommendations expressed in this material are those of the author(s) and do not necessarily reflect the views of the National Science Foundation.