Tag Archive: Taulbee Data Analysis

Data Analysis from the Taulbee Survey Report.

Taulbee in Depth: Department Space per Faculty Member


Every three years, the CRA Taulbee Survey asks a set of Department Profiles questions including questions about department space. In the full Taulbee report published in CRN in May 2013, we reported on the space data collected in fall 2012. Tables in that report provided percentiles for department space in the categories of total space, offices, conference and seminar rooms, research labs, and instructional labs. The percentiles were across all departments of a given type (US CS Public, US CS Private, US CE, US Information, and Canadian) without regard for the size of the department. However, department size is clearly a major determiner of space. To allow departments to better compare their own space allocations to the overall Taulbee numbers, this analysis reports on space per faculty member in two ways: by number of tenured and tenure-track faculty, and by number of tenured and tenure-track faculty plus number of research faculty and postdocs. Those values were computed for each department; percentiles of the normalized space for all US departments and for each type of department are given in tables.

2012 Taulbee Report Sneak Preview


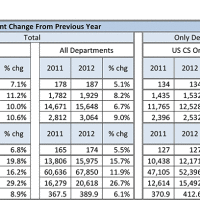
The full 2012 Taulbee Report will be published in the May 2013 issue of CRN. However, the degree and enrollment numbers for bachelor’s and doctoral level programs in the departments responding to the survey have been compiled at this time, and they should be of interest to our members and readership. Thus, we are providing a sneak preview into these data.

Counting Computing: CRA Taulbee Survey and NSF Statistics


When people in the computing field talk about numbers in computing – numbers of degrees granted, students enrolled, faculty, dollars in salary or research expenditures – they often refer to the annual CRA Taulbee Survey. But Taulbee is not the only source of information on computing. How do Taulbee results compare to some of the other available information?

Taulbee In-Depth: PhD Specialty Areas


The CRA Taulbee Survey reports new PhDs and their employment by specialty area each year. This article is an in-depth look at these numbers for data gathered in 2008 – 2011 including a total of 7,178 PhDs. Results by specialty area are presented only for those with specialty areas that are not “other” or “unknown,” which is a total of 5,666 PhDs (78.9%). Similarly, percentages by gender, ethnicity, and citizenship are only for those who were not reported as “unknown.”

Cross Flow Among the 2010 Computing Innovation Fellows


For a second straight year, this summer the Computing Research Association, with fund-ing from the National Science Foundation, extended offers of one- to two-year postdoctoral fel-lowships to new Ph.D.s, in an attempt to retain recent graduates in computing research and teaching during difficult economic times (see 1,2 for details). A key requirement of the CIFellows Project has been to support intellectual diversity in computing fields at U.S. organizations.

US CS New Majors, Enrollment Both Continue Increase in 2008-2009


CRA’s Taulbee Survey of Ph.D.- granting Computer Science (CS) and Computer Engineering departments in North America has been conducted annually since 1974. Results from the most recent survey will be provided to participants and CRA members in early March. They will be published on CRA’s website (http://www.cra.org/statistics/) and in Computing Research News in May. Due to widespread interest, CRA releases data on undergraduate degrees early.

US CS New Majors, Enrollment Both Rise in 2007-2008


CRA’s Taulbee Survey of Ph.D.-granting Computer Science (CS) and Computer Engineering departments in North America has been conducted annually since 1974. Results from the most recent survey were provided to participants and CRA members in February. They will be published on CRA’s website (http://www.cra.org/statistics/) and in Computing Research News in May. Due to widespread interest, CRA releases data on undergraduate degrees early.

African-American Researchers in Computing Sciences: A Model for Broadening Participation


According to the most recent Computing Research Association (CRA) Taulbee Survey, African-Americans represent 1.3 percent of all computing sciences faculty. Nationally, across all disciplines, African-Americans represent 5.2 percent of all academic faculty. The African-American Researchers in Computing Sciences (AARCS) program was funded by the National Science Foundation’s Broadening Participation in Computing (BPC) program in 2006. It aims to narrow the gap between computing science faculty and the national average by eliminating disbeliefs, concerns and misunderstandings about graduate school, research, and computing sciences faculty among African-American undergraduate computing sciences majors.

Enrollments and Degree Production at US CS Departments Drop Further in 2006-07


CRA’s Taulbee Survey of Ph.D.-granting Computer Science (CS) and Computer Engineering departments in North America has been conducted annually since 1974. Results from the most recent survey were provided to participants and CRA members in February. They will be published on CRA’s website (http://www.cra.org/statistics/) and in Computing Research News in May. Due to widespread interest, CRA releases data on undergraduate degrees early.

Starting Salary Offers to CS Majors


There are many sources for salaries in the information technology sector. Most focus on specific occupations or types of industry. The National Association of Colleges and Employers reports starting salary offers to new college graduates at the bachelor’s degree level. The survey collects data from college and university career services offices.