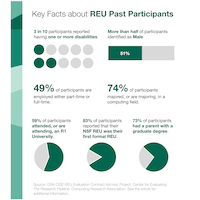
Who has participated in an NSF CISE REU in the last ten years?
This infographic summarizes the demographic makeup of CISE REU Past Participants who participated in REU projects between 2013 and 2021.

Tag Archive: CERP Infographics
These infographics are brought to you by the CRA’s Center for Evaluating the Research Pipeline (CERP). CERP provides social science research and comparative evaluation for the computing community. To learn more about CERP, visit our website.
This material is based upon work supported by the National Science Foundation under Grant Number (CNS-1246649; DUE-1431112). Any opinions, findings, and conclusions or recommendations expressed in this material are those of the author(s) and do not necessarily reflect the views of the National Science Foundation.
This infographic summarizes the demographic makeup of CISE REU Past Participants who participated in REU projects between 2013 and 2021.
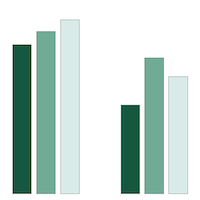
In this infographic, we compared students’ involvement in teaching and mentoring activities by their reported gender identity. Results indicate statistical differences between groups at the p ≤ .05 level.

CERP presents results on what aspects of a career undergraduate students and graduate students consider most important.
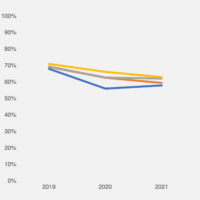
Data from the CRA Data Buddies Survey (DBS) 2019, 2020, and 2021, indicates that students interacted with their classmates outside of the lectures less frequently after the COVID pandemic and the change was more drastic for students who were earlier on in their academic program.
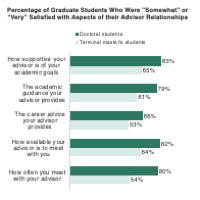
CRA’s Data Buddies Survey 2021 data indicate that students in doctoral programs are more likely than their peers in terminal master’s programs to report being satisfied with their advisor relationships across a set of advisory domains.
Career Mentoring Workshops are designed to support individuals in early and mid-career stages. Evaluation results indicate that after the workshop, as compared to before the workshop, participants were more likely to report they knew people to whom they could go to for guidance on how to advance their career.

As prospective students consider postsecondary degree programs, a common question that emerges is how to pay for that program. What are the more common funding sources that students ultimately use? CERP investigated how students at different degree types pay for their program, as reported in late 2021.
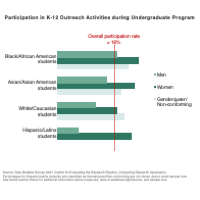
CRA’s Data Buddies Survey 2021 data indicate that 16% of undergraduates in computing fields have been involved in K-12 outreach during their degree program. Participation rates across different racial and ethnic groups varied. Within racial/ethnic groups, participation rates also varied as a function of gender identity.

Analysis suggests that job prospects weigh heavily on students’ decision to skip or delay graduate education. Further, while the importance of some of the reasons remain the same across students at different stages of their degree program, others vary in terms of their salience depending on how close students are to graduating.
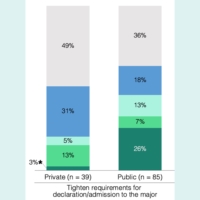
Using data from the new Policies and Data Practices Survey, this analysis looks at the actions higher education institutions took to address increasing enrollments. Academic units in private institutions were significantly less likely to tighten their admission/enrollment requirements and to advise less successful students to consider other majors compared to those in public institutions.

Where do graduate students find mentors? CERP revisited a prior analysis with updated data from the 2020 Data Buddies Survey and discovered the most common sources for mentors. Additionally, CERP uncovered some significant differences between where men and women graduate students find mentors.


