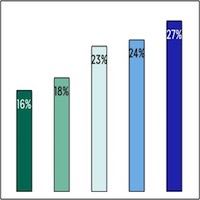
Which Students are Attending Technical Conferences in Computing?
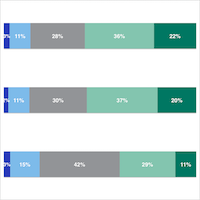
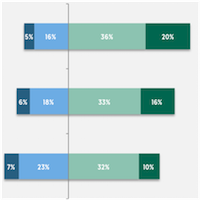
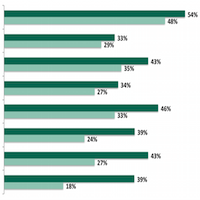
CERP data indicate first year and second year students were proportionally less likely to attend a technical conference in computing over the past year compared to upper division students. This finding is important because participation in conferences may help foster engagement and retention in computing, particularly among first and second year students.